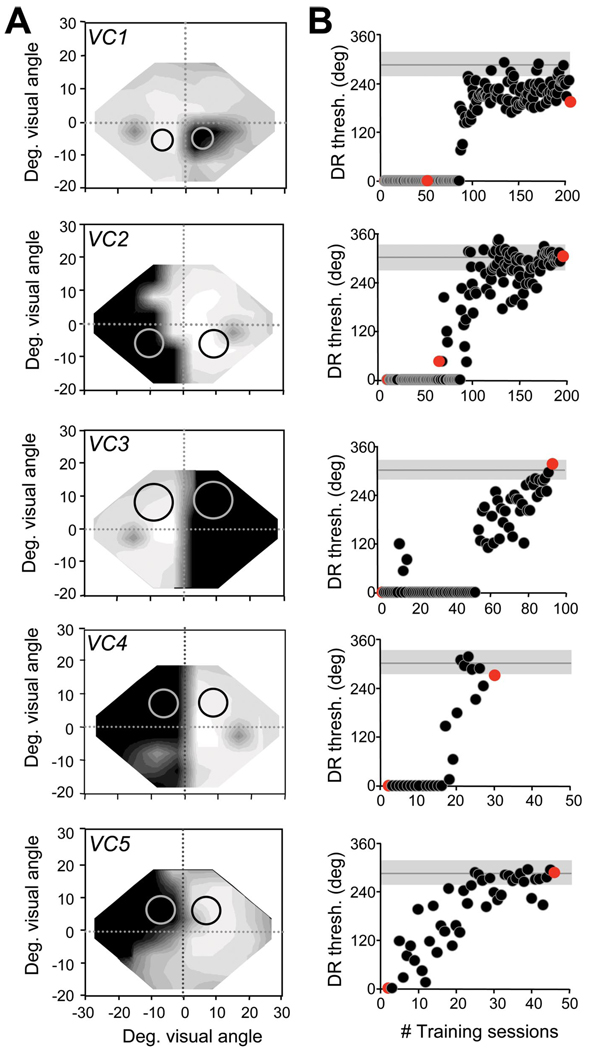
Figure 1.
Training-induced improvements in direction range thresholds in the blind fields of VC1–VC5. A, Size and location of random-dot stimuli on which subjects were first trained in their blind field indicated on composite Humphrey visual field maps (for grayscale, see supplemental Fig. 1, available at www.jneurosci.org as supplemental material). Circles illustrate the sizes and locations of random-dot stimuli used to measure performance at equivalent locations in the intact and blind hemifields.B, Scatter plots of direction range (DR) threshold (thresh.) performance as a function of the number (#) of training sessions administered at blind field locations in A. Black dots represent data collected by the subjects during in-home training. Red dots represent data collected from the same subjects in the laboratory, where central fixation was controlled using an integrated ISCAN system. Note the close correlation between the subjects’ in-home performance and that recorded in the laboratory. Note also the variability in the number of training sessions, each consisting of 300 trials, required for different subjects’ direction range thresholds to reach and stabilize within the normal range. This normal range was represented by the mean (gray horizontal line) and SD of the mean (gray shaded area around the gray line) direction range thresholds obtained at the “control” locations in the intact hemifield of each subject (black circles in A). Deg., Degree.

