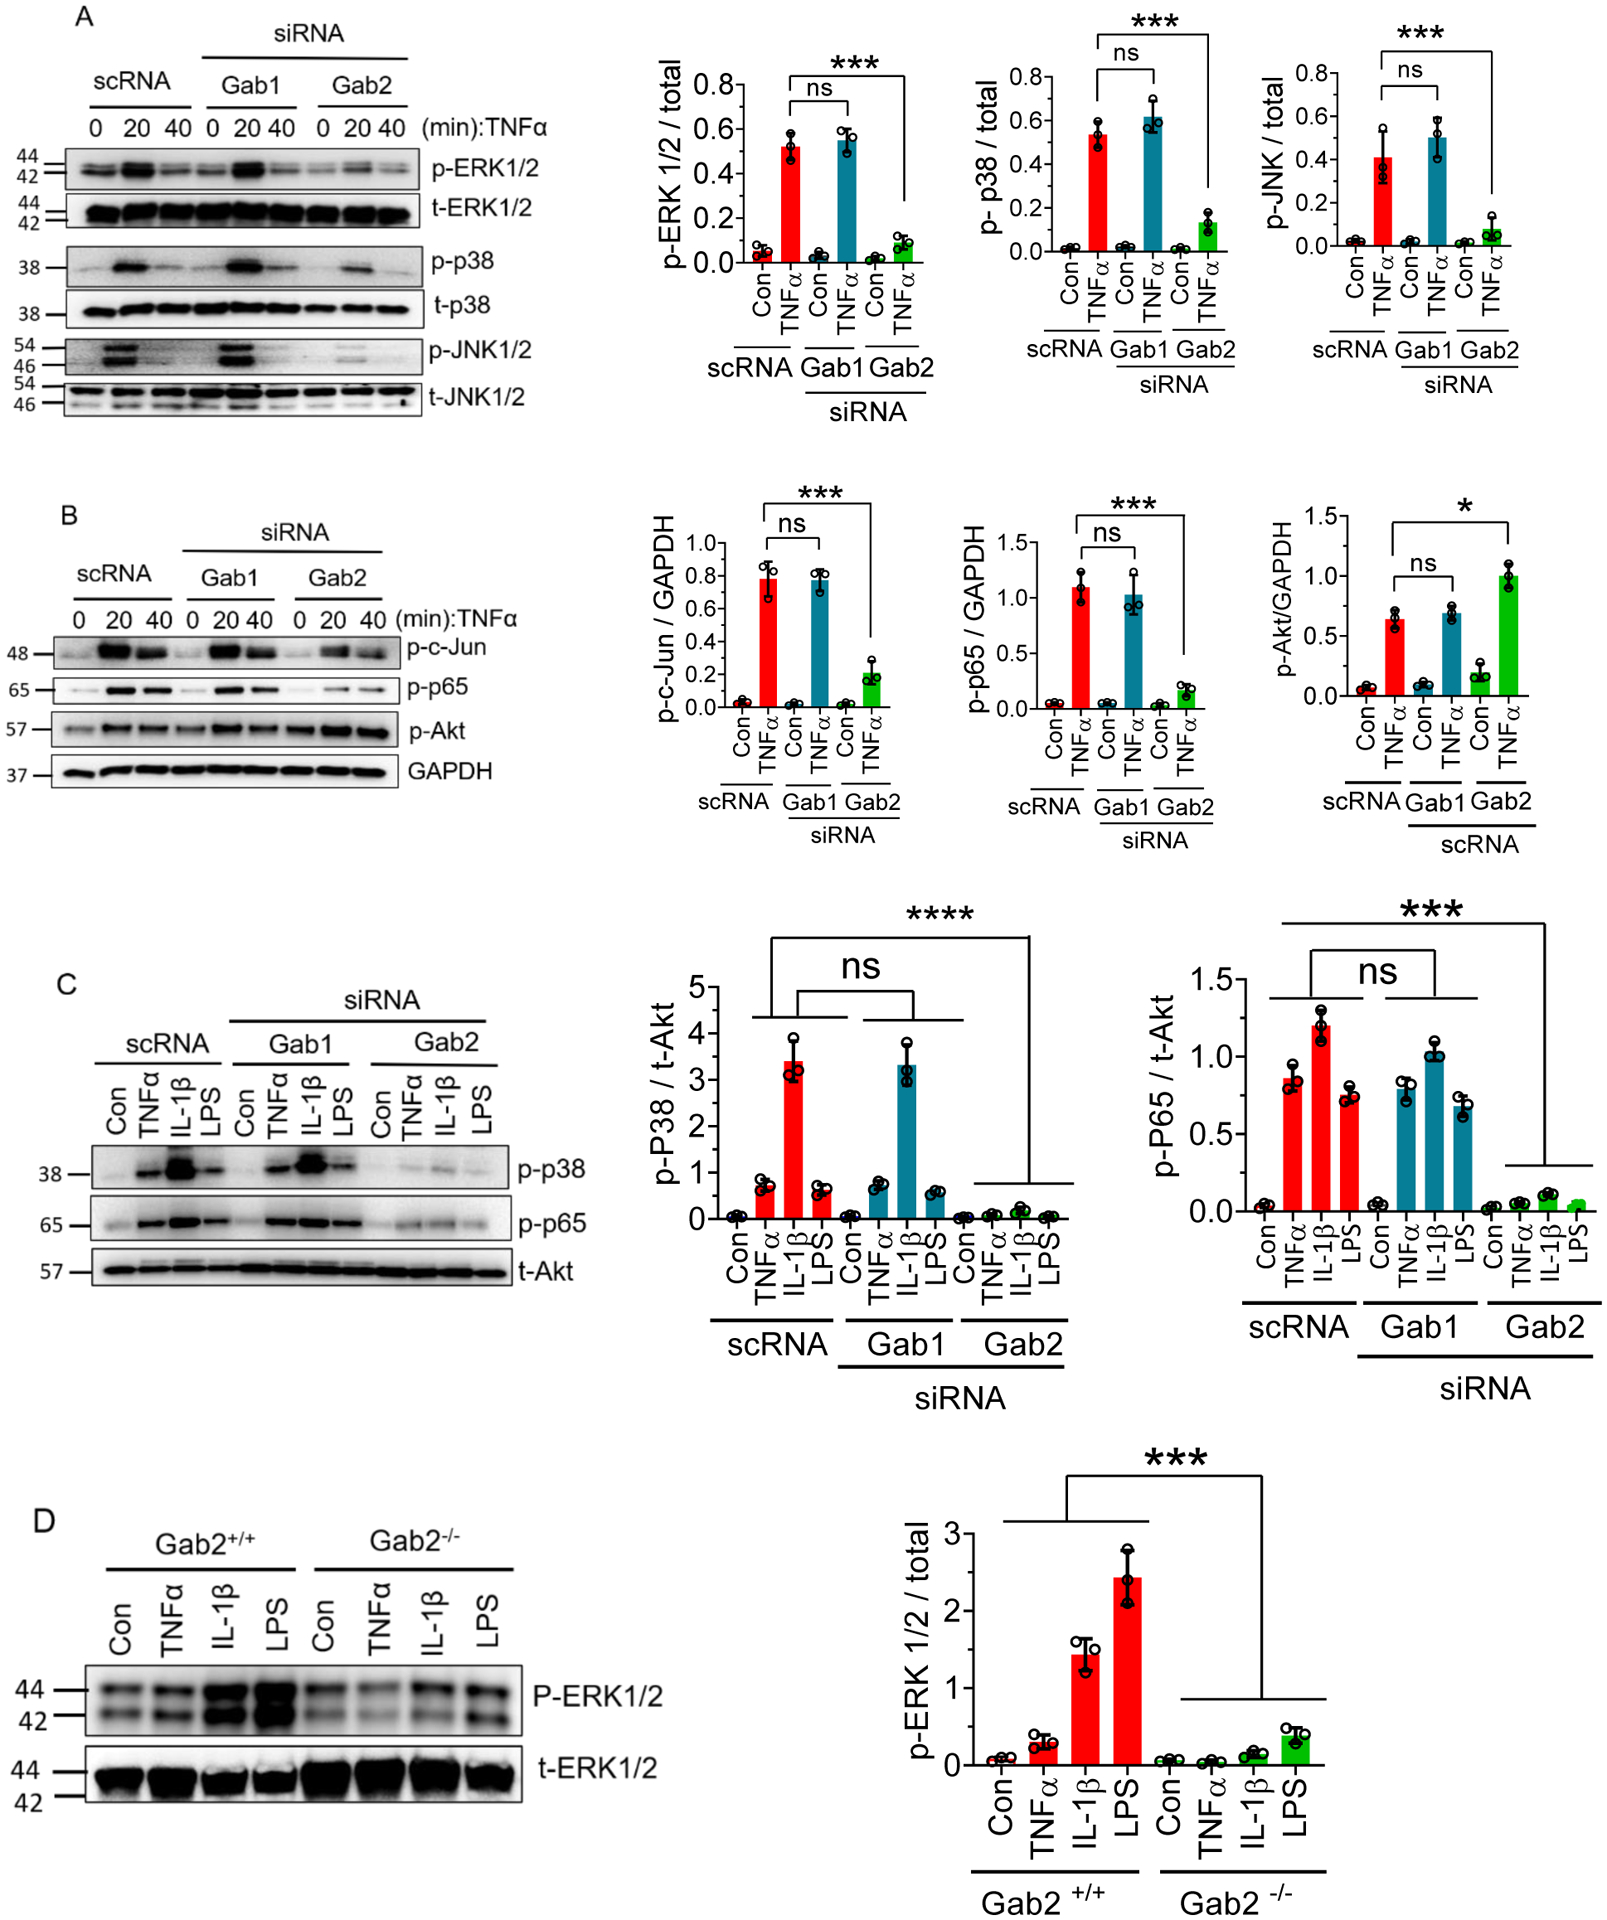
Fig. 3. Gab2 silencing blocks TNFα-, IL-1β-, and LPS-induced signaling in the endothelial cells.

(A, B) HUVEC transfected with Gab1 or Gab2 siRNA, or scrambled siRNA (scRNA) were serum-starved overnight and treated with TNFα (10 ng/ml) for the indicated times. The cell lysates were subjected to immunoblot analysis to probe for the phosphorylated ERK1/2, JNK1/2, p38, Akt, c-Jun, and NF-κB (p65) using phospho-specific antibodies. Immunoblots were also probed for total ERK1/2, p38, JNK1/2, or GAPDH for loading controls. Band intensities at 20 min time point were quantified by densitometry, and these data were shown in the right side panels. (C) HUVEC transfected with Gab1 or Gab2 siRNA, or scrambled siRNA were treated with TNFα (10 ng/ml), IL-1β (10 ng/ml), or LPS (500 ng/ml) for 30 min. The cell lysates were analyzed for the activation of p38 and NF-κB (p65) by immunoblot analysis. Band intensities were quantified by densitometry, and these data were shown in the right side panels. (D) Mouse brain endothelial isolated from Gab2−/− or WT littermate control mice (Gab2+/+) were serum-starved overnight and treated with TNFα (20 ng/ml), IL-1β (20 ng/ml), or LPS (1 μg/ml) for 30 min. The cell lysates were evaluated for the phosphorylation of ERK1/2 by immunoblot analysis. Band intensities were quantified by densitometry, and the quantified data were shown in the right side panels. Student’s t-test was used to calculate statistically significant differences for data shown in panels A and B. For others, one-way analysis of variance (ANOVA) was used to compare the data of experimental groups, and Tukey’s post hoc multiple comparison test was used to obtain statistical significance between the two groups. ***, p<0.001; ns, no statistically significant difference.
