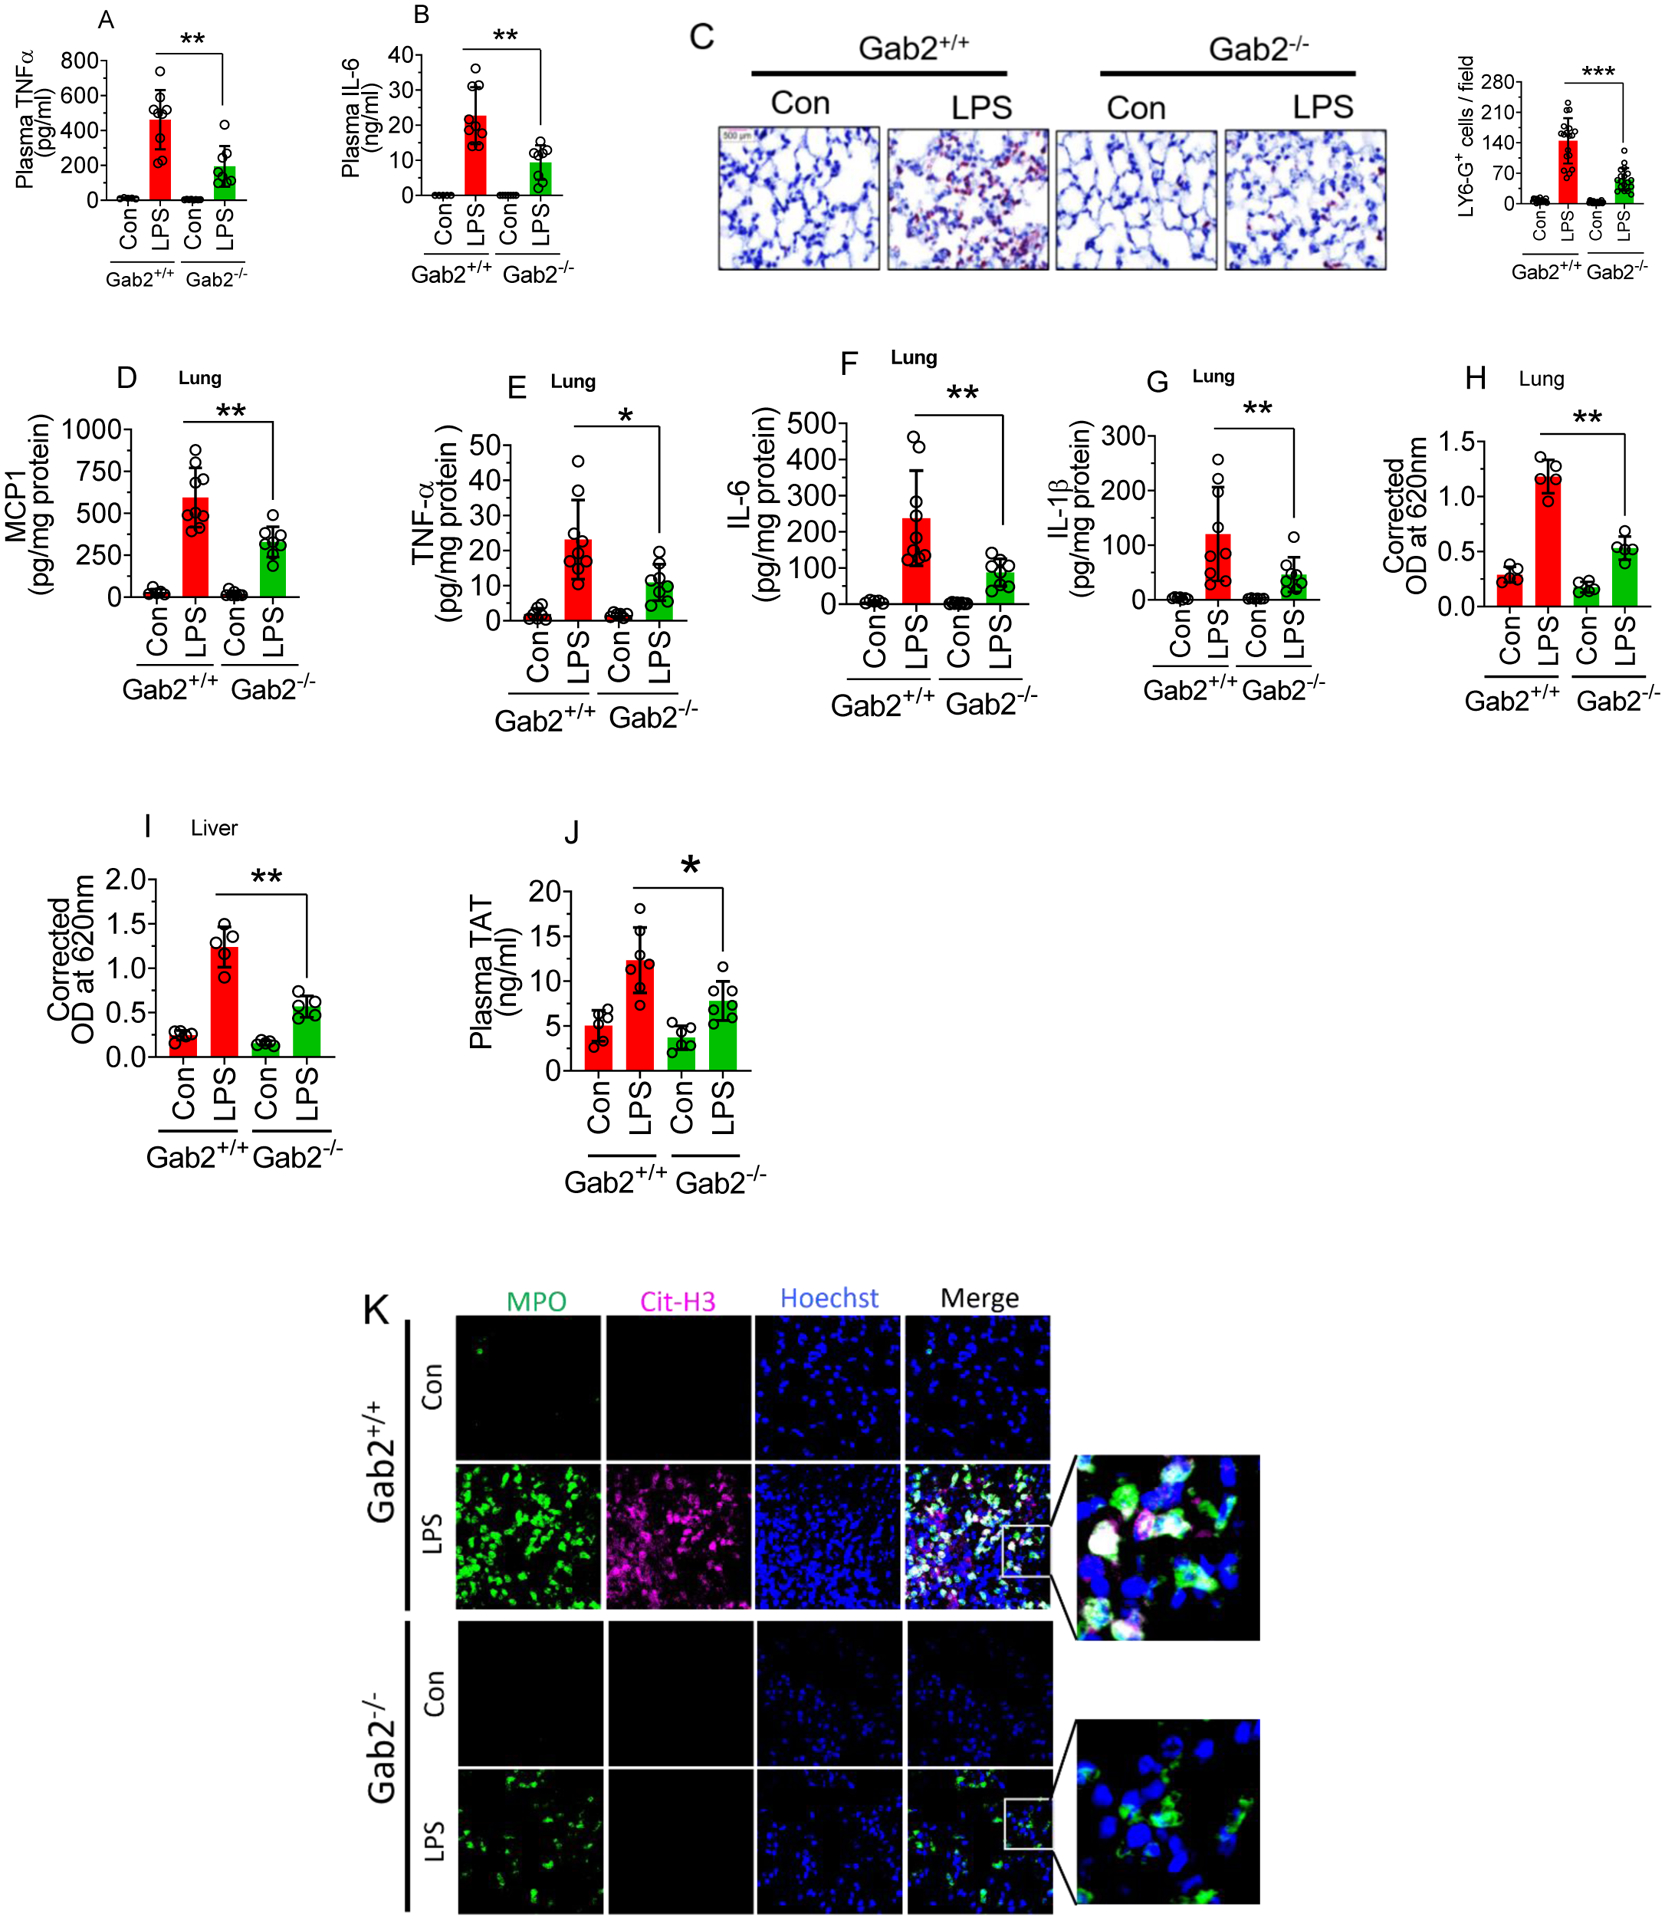
Fig. 7. Gab2−/− mice were resistant to LPS-induced systemic inflammation.

Gab2−/− and WT littermate control mice (Gab2+/+) were administered with LPS (5 mg/kg b.w) i.p. Six hours following LPS administration, blood was collected via submandibular vein puncture. TNFα (A) and IL-6 (B) levels in plasma were measured by ELISA. (C) The lung tissue sections were immunostained with neutrophil marker LY-6G or isotype control IgG. The sections were visualized under ×40 magnification. The number of LY-6G–positive cells were counted at 3 randomly chosen areas covering the entire sections of 6 different mice. Left, Representative images of tissue sections stained with LY-6G. Right, Count of LY-6G-stained cells/field. (D-G) The lung tissue lysates were assayed for MCP-1 (D), TNFα (E), IL-6 (F), or IL-1β (G) using ELISA. (H,I) Gab2−/− and WT littermate control mice were administered with LPS (5 mg/kg b.w) i.p. After 16 h, 100 μL of 1% Evans’s blue dye was injected into the mice via intravenously. After 1 h, the mice were euthanized, perfused transcardially with saline. Lung and liver tissues were collected, and Evan’s blue dye associated with the lungs (H), and the liver (I) were measured as the index for vascular permeability. (J,K) Gab2−/− and WT littermate control mice (Gab2+/+) were administered with LPS (5 mg/kg b.w) i.p. Twenty-four hours following LPS administration, blood was collected via submandibular vein puncture and lung tissues were harvested. Plasma TAT levels were measured by ELISA (J). The lung tissue sections were immunostained for MPO (green), citrullinated-histone H3 (Cit-H3, magenta), or isotype control IgG (K). The sections were visualized under 63X magnification. Student’s t-test was used to calculate statistical significant differences. ****, p < 0.0001; ***, p < 0.001; **, p < 0.01; *, p < 0.05.
