
Figure 1.
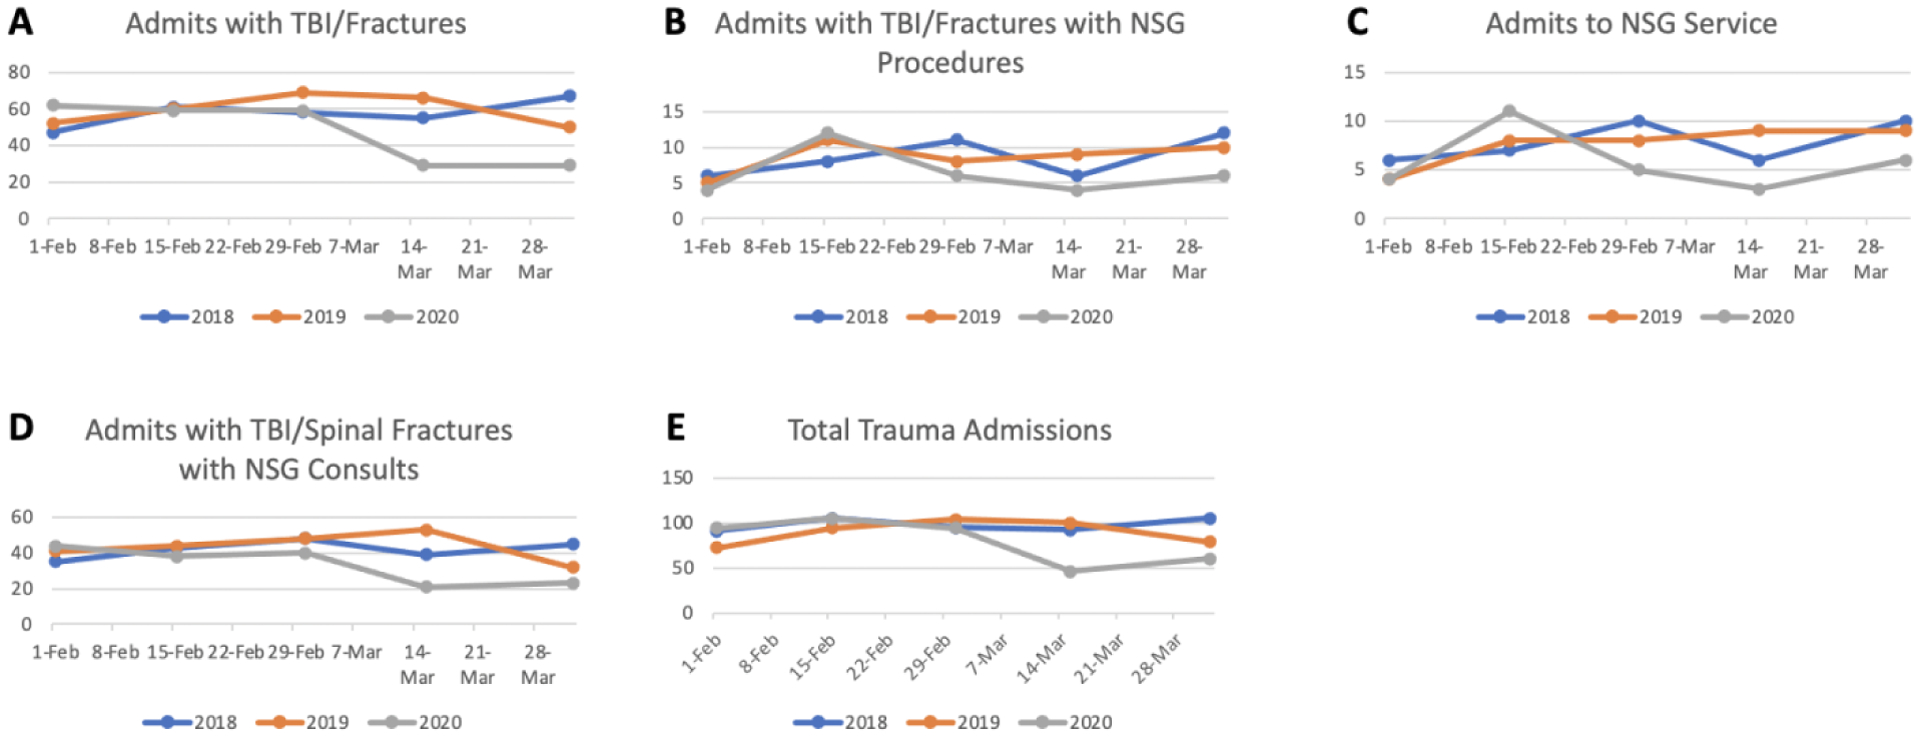
Line graphs of the combined patient census for Stanford Hospital and Santa Clara Valley Medical Centers in the weeks before and after quarantine implementation. Plots depict number of traumas with A) TBI or spinal fractures B) neurosurgical procedures C) admission to the neurosurgery service and D) neurosurgery consults. Plot E) depicting total traumas. ED, emergency department; NSG, neurosurgery.