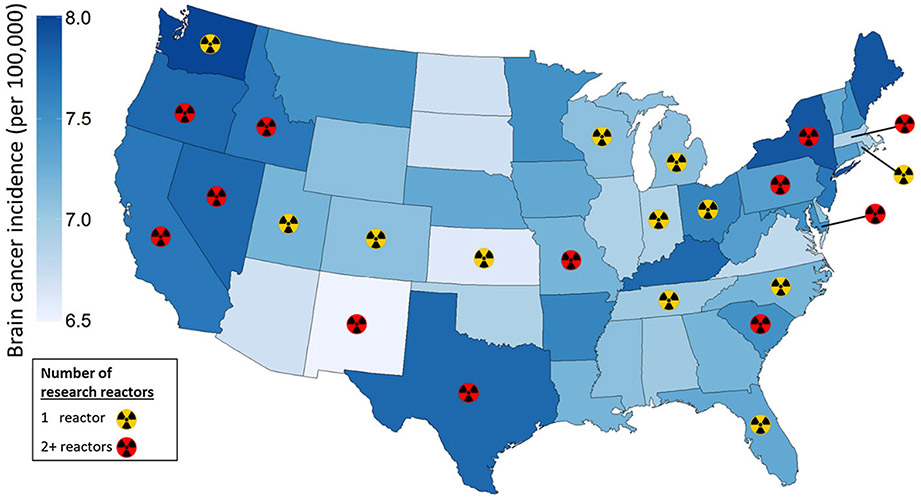
Fig. 1.
Map of brain cancer incidence rates and nuclear research reactor number. State-level map of brain cancer incidence rates per 100,000 for all ages, males and females combined. Rates are age-adjusted 5-year averages. Rates for 44 states are for Non-Hispanic Whites (NHWs). Six states (DE, IL, KS, KY, MA, and PA) did not have such rates available, and rates for Whites including Hispanics (WIH) were used. Alaska and Hawaii (not shown) have rates of 7.2 and 7.3, and both have 0 research reactors

