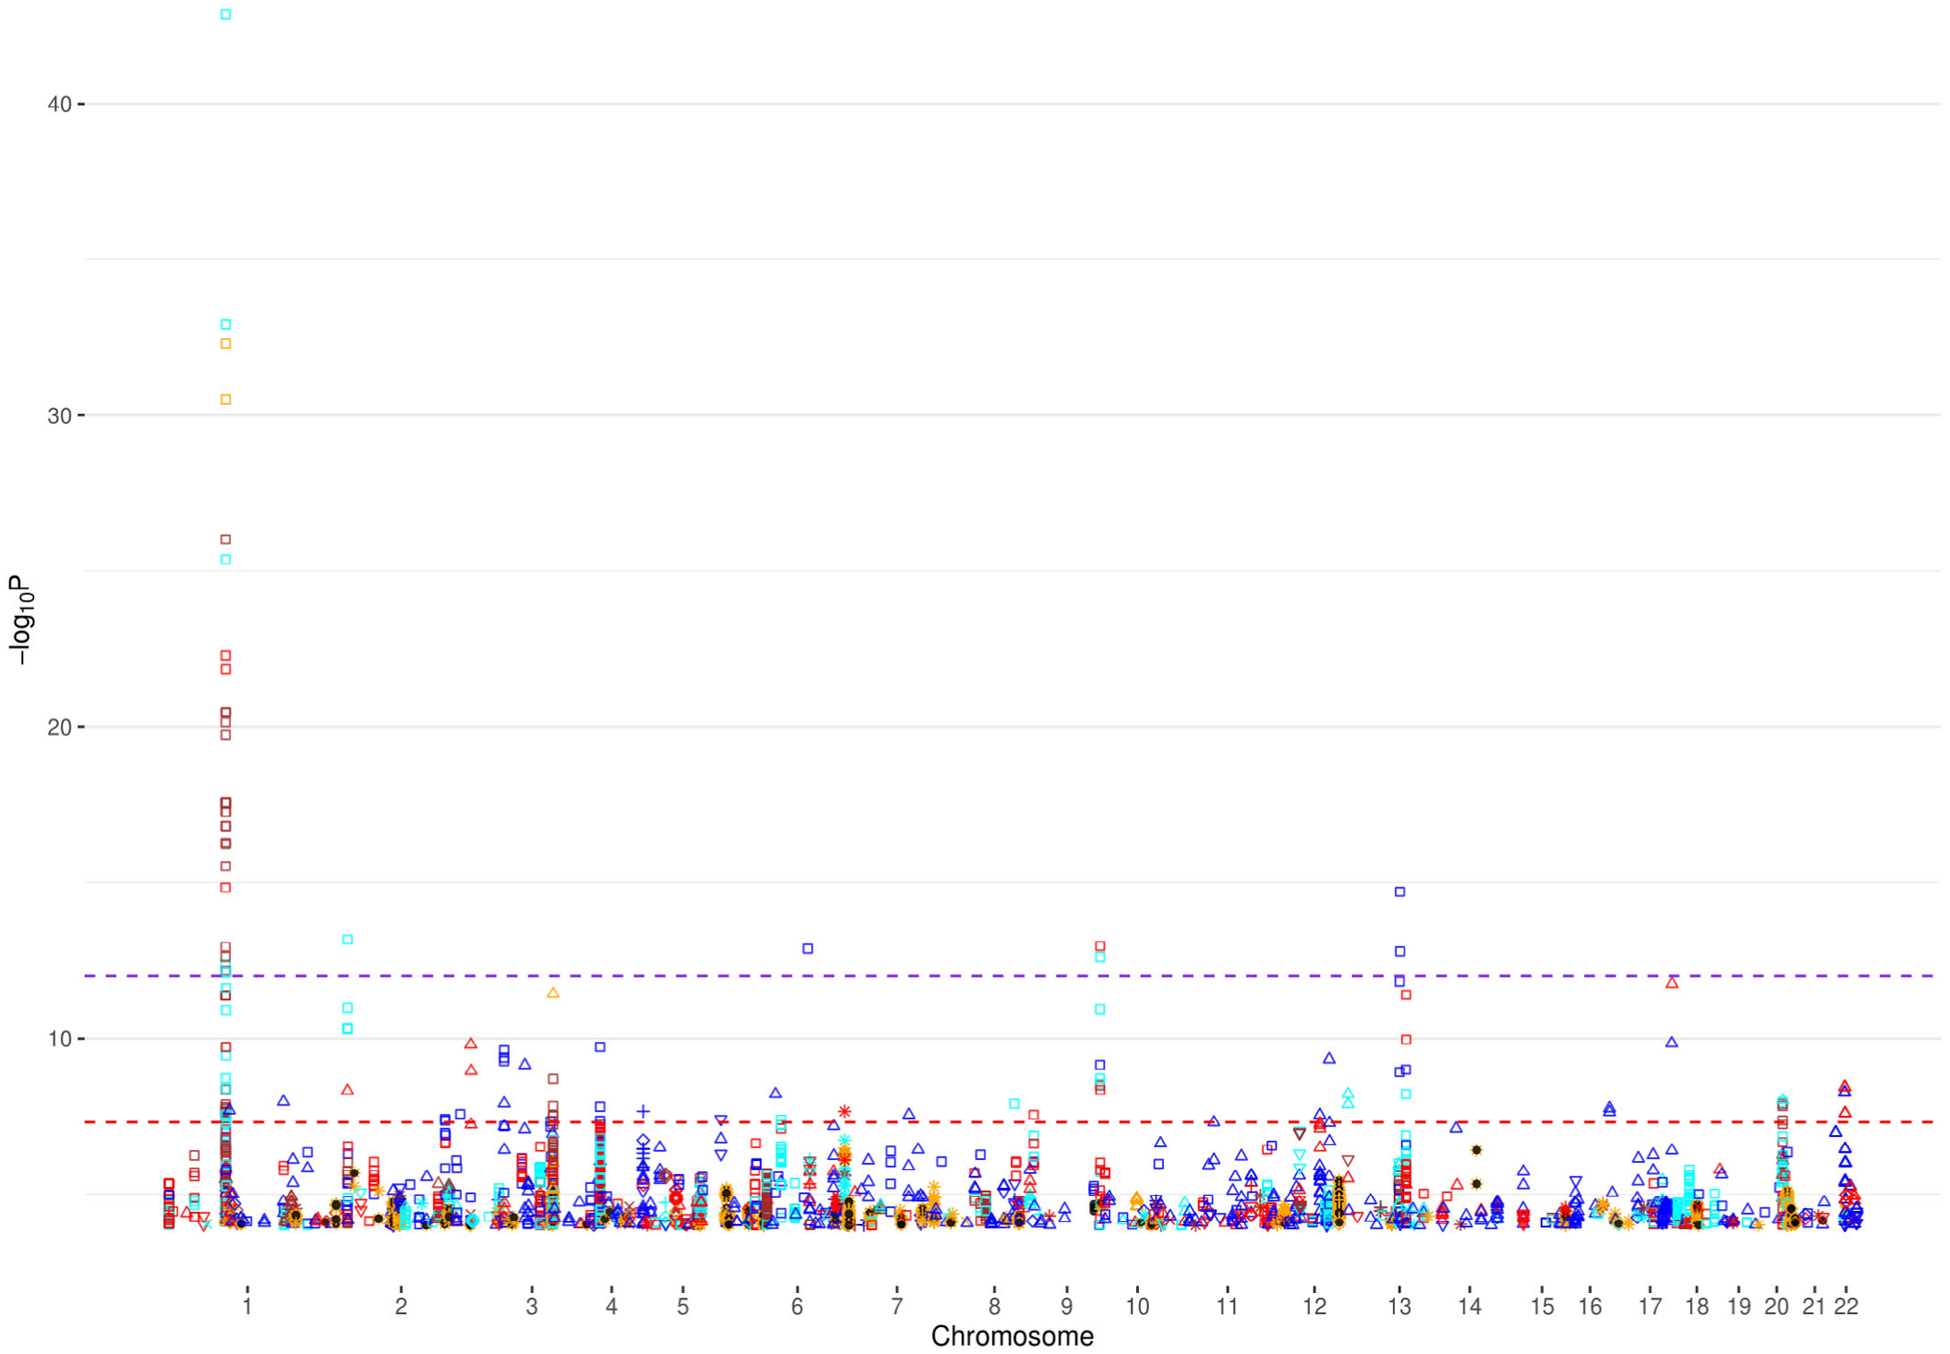
FIGURE 1.

Manhattan plot for chromosomes 1–22 for PTSD. ● denotes reported signals from the original GWAS and the remain symbols and colors denote DISTMIX2 imputed signals. Among imputed signals blue denotes info<0.2, red denotes 0.2 < info<0.4, cyan denotes 0.4 < info<0.6, brown denotes 0.6 < info<0.8, orange denotes info>0.8, □ denotes MAF <0.05%, △ denotes 0.05% < MAF < 0.5%, ▽denotes 0.5% < MAF < 1%, + denotes 1% < MAF < 2%, ◊ denotes 2% < MAF < 5%, x denotes 5% < MAF < 10% and * denotes 10% < MAF < 50%. The red line is the default genome-wide threshold of p = 5*10e-8, which is applicable common SNPs with moderate to large Info values. The purple line at p = 10e-12 is the threshold to be used for rare and/or low Info variants. GWAS, genome-wide association studies; MAF, minor-AF; PTSD, post-traumatic stress disorder; SNPs, single nucleotide polymorphisms
