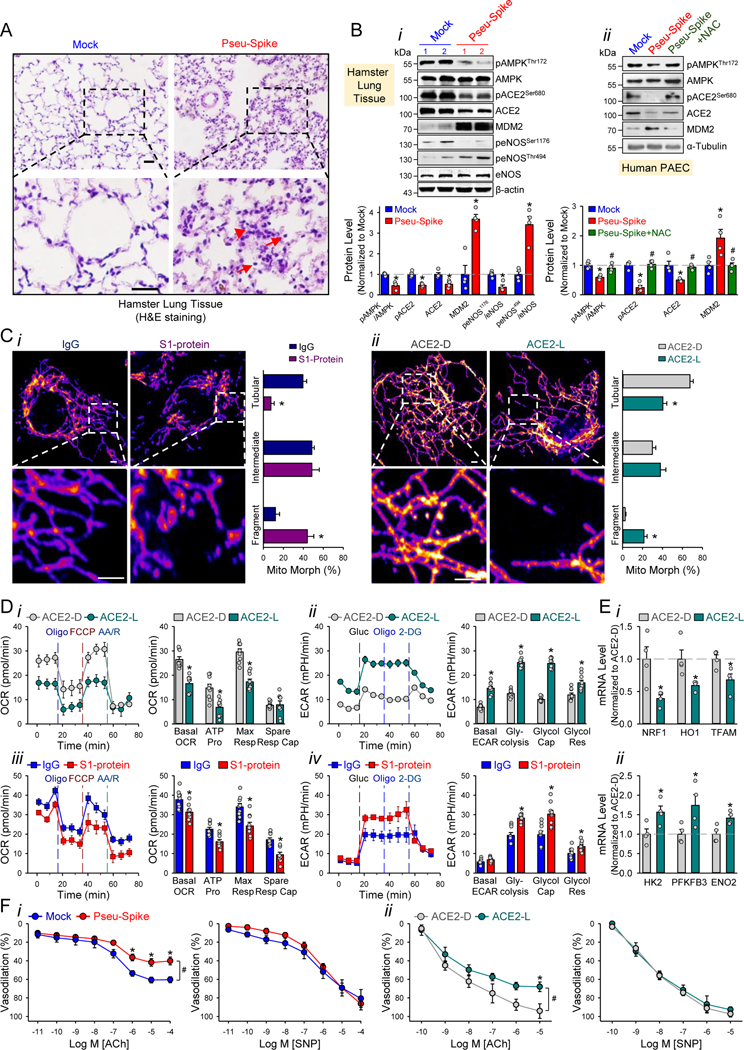
Figure 1. SARS-CoV-2 Spike protein exacerbates EC function via ACE2 downregulation and mitochondrial impairment.
A, Representative H&E histopathology of lung specimens from 8–12 week-old male Syrian hamsters 5-day post administration of pseudovirus overexpressing Spike protein (Pseu-Spike) or mock virus in control group (n=3 mice per group, 1×10⁸ PFU). Thickened alveolar septa (red arrowhead) and mononuclear cell (red arrow). Scale bar = 20 μm. B, Pseu-Spike (n=4) or mock virus (n=4)-infected hamster lungs were subjected to Western blot analysis for pAMPK T172, AMPK, pACE2 S680, ACE2, MDM2, peNOS S1176, peNOS T494, eNOS, and β-actin (Bi). Human PAECs were infected with Pseu-Spike or mock virus for 24 hr with or without NAC (5 mmol/L) pre-treatment for 2 hr. The protein extracts were analyzed by Western blot using antibodies against proteins as indicated (n=4) (Bii). C, Representative confocal images of mitochondrial morphology of ECs treated with human recombinant S1 protein or IgG (4 μg/ml) for 24 hr (Ci) or infected with human adenovirus ACE2 S680D (ACE2-D) or ACE2 S680L (ACE2-L) (10 MOI) for 48 hr (Cii). Mitochondria were visualized using TOM20 antibody (n=4, 50 cells counted for each replicate). Scale bar = 2.5 μm. “Tubular”: the majority of mitochondria in ECs was >10 μm in length; “Intermediate”: the mitochondria were less than ~10 μm; “Fragment”: the majority of mitochondria were spherical (no clear length or width). D, Measurement of oxygen consumption rate (OCR, Di and Diii) and extracellular acidification rate (ECAR, Dii and Div) in ECs infected with ACE2-D versus ACE2-L (10 MOI) for 48 hr (n=3) or treated with IgG versus S1 protein (4 μg/ml) for 24 hr (n=3). E, RT-qPCR analysis of the indicated mRNA levels in lung ECs from ACE2-D (n=4) and ACE2-L (n=4) knock-in mice. Eight-week-old ACE2-D and ACE2-L male mice with C57BL/6 background were used. F, Dose-response curves of acetylcholine (ACh, left panels)- and sodium nitroprusside (SNP, right panels)-mediated relaxation on the tension of phenylephrine (1 μmol/L) precontracted intrapulmonary artery stripes from Pseu-Spike-(ACh n=8, SNP n=5) or mock-(ACh n=6, SNP n=5) virus infected Syrian hamsters (1×10⁸ PFU) (Fi) and ACE2-D (n=6) or ACE2-L (n=5) mice (Fii). The animal experiments were approved by the ethical committee of Xi’an Jiaotong University.

