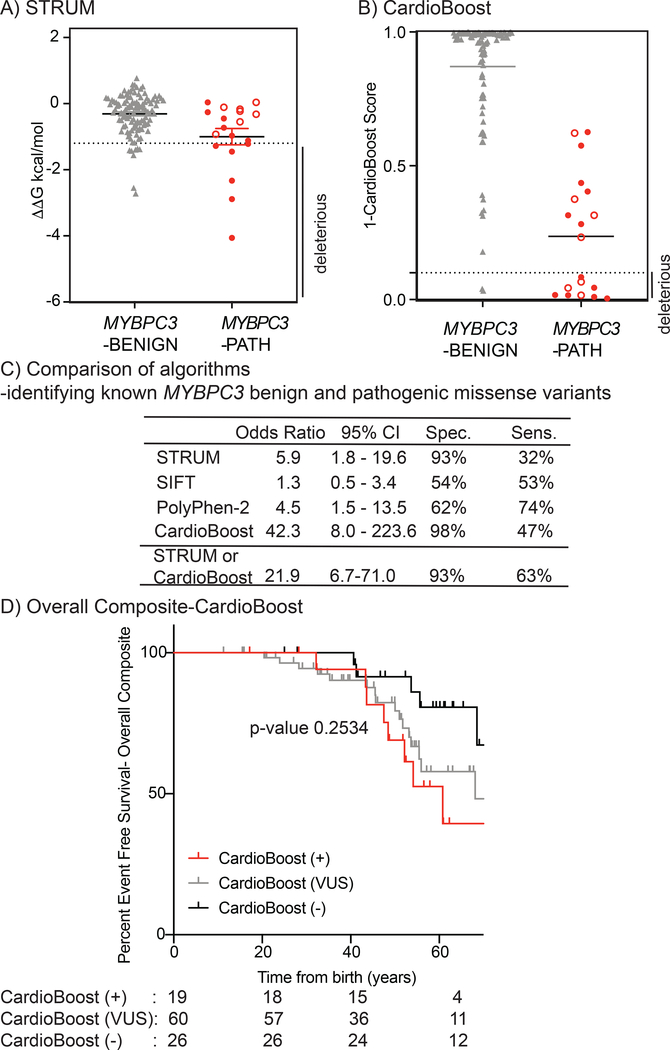
Figure 3. STRUM is complementary to CardioBoost.
Results of computational analysis for each unique MYBPC3-Benign (grey triangles, n= 110) and MYBPC3-Path (red circles, n =19) variant are shown for (A) STRUM and (B) CardioBoost. Mean and SEM for each group depicted. The cut-off for deleterious variants for STRUM was ΔΔG ≤−1.2 kcal/mol. The cut-off for deleterious variants for CardioBoost (CardioBoost+) was a probability score > 0.90 this is graphed as 1-CardioBoostScore <0.10. C3 pathogenic variants are depicted in open circles in panel A and B. (C) Statistical Analysis of computational method utilized herein STRUM (Figure 3), CardioBoost (Figure 3), SIFT (Figure S6), and Polyphen-2 (Figure S6) is shown including Odd’s ratio, 95% confidence interval (CI), Sensitivity, and Specificity. (D) Using the same patient selection criteria in SHaRe detailed in Figure 1, patients with HCM and a MYBPC3 missense VUS were analyzed by CardioBoost. CardioBoost (+) was a probability score > 0.90, CardioBoost VUS ≥0.10 and ≤ 0.90, and CardioBoost (−) < 0.10. Of the 105 patients analyzed by STRUM 19 were CardioBoost(+).Kaplan Meier curves reveal that patients carrying a CardioBoost (+) MYBPC3 VUS (red) exhibited higher rates of adverse HCM-related outcomes (Overall Composite), than patients carrying a CardioBoost (−) MYBPC3 VUS (black), however the null hypothesis could not be excluded, p-value 0.0945. This remains true when comparing patients carrying a MYBPC3 VUS that is CardioBoost (+) (red), CardioBoost (VUS) (grey), and CardioBoost (−) (black) (p-value 0.2534).

