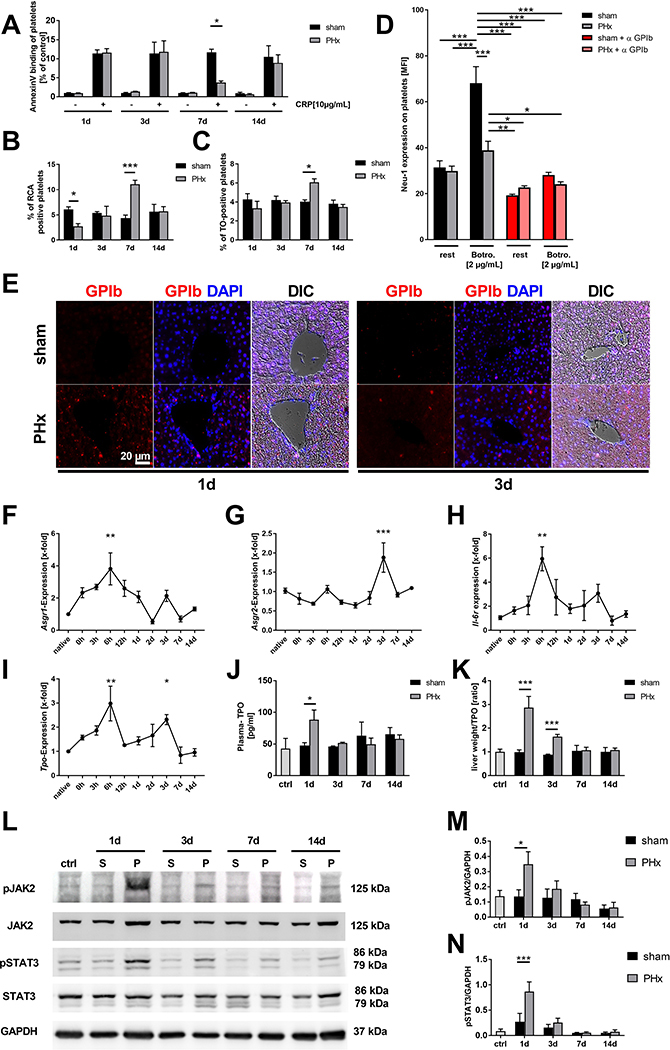
FIG. 4.
Efficiently restored TPO production is mediated via desialylated platelet uptake into the diseased liver by the AMR and JAK2 / STAT3 signaling. (A) AnnexinV-binding of GPIb positive platelets stimulated with CRP in regard to control group of each time point (n = 1+3d: 8 sham + 9 PHx; 7+14 d: 4 sham, 4 PHx). (B) Analysis of platelets positive for binding of the RCA-1 lectin (RCA-1 = Ricinus communis agglutinin-1) at indicated time points (n= 4 sham, 5 PHx). (C) Thiazol orange staining for RNA-rich, young GPIb positive platelets measured via flow cytometry (n= 8 sham + PHx for 1d + 3d; 4 sham, 5 PHx for 7+14d). (D) Neuraminidase (Neu)-1 expression at the platelet surface of sham and PHx operated mice was determined after Botrocetin (Botro.) and anti-GPIbα treatment of platelets (n = 6). (E) Representative images showing staining of paraffin embedded liver tissue sections for GPIb positive platelets at indicated time points. Nucleus staining performed with DAPI. Merge with differential interference contrast (DIC) is shown (n =4). (F-I) Gene expression of different target genes was analyzed using the 2−ΔΔCt method (n= native animals 3; 0h: 4 animals; 3h-14d: 5–6 animals). (J) TPO level measured in plasma of mice with (K) calculated plasma TPO levels in regard to measured liver weight of the same animals (n = control 3; 1d = 6 sham, 7 PHx; 3/7/14d = 4 mice/group). (L) Representative immunoblots of total liver cell lysates using anti-pJAK2 and anti-JAK2 antibodies and anti-pSTAT3 and anti-STAT3 monoclonal antibodies. GAPDH was used as loading control. (M and N) Densitometric analysis of pJAK2 and pSTAT3 with regard to loading control (n=4). Depicted are mean values + s.e.m.; *P<0.05, **P<0.01, ***P<0.001 using ordinary Two-Way ANOVA with Bonferroni’s post-hoc test, D was analysed using Three-Way ANOVA with Bonferroni’s post-hoc test, F-I were analyzed using ordinary One-Way ANOVA with Dunnett’s post-hoc test.

