
Figure 5. High-density lipoprotein (HDL) transcriptome-wide association study (TWAS) results.
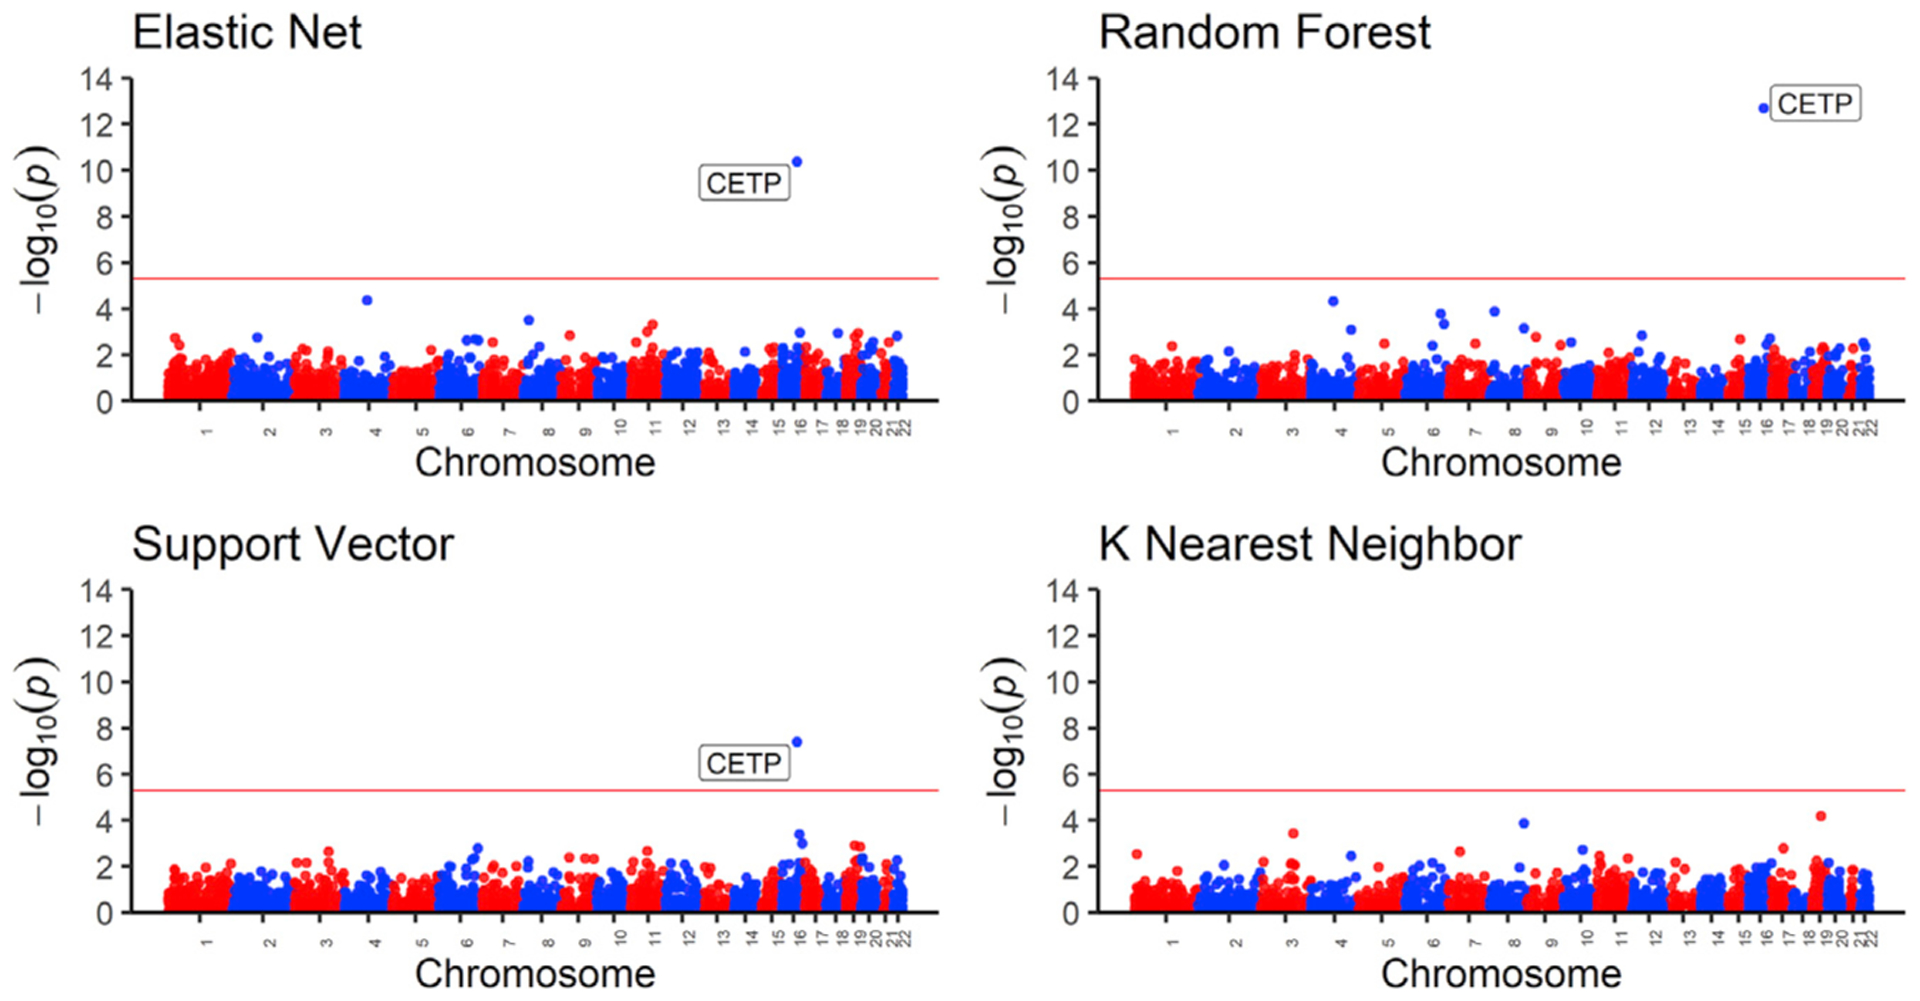
Manhattan plot of the gene p values from the TWAS between HDL values and predicted gene expression. Using models trained in MESA ALL cohort, we predicted gene expression in MESA (n = 3,856) genotype data comprising individuals not used in the model training with HDL phenotype data and then carried out in TWAS. Genome-wide significance (p < 3.3 × 10⁻⁶) is shown by the red line in the plots. The x axis is ordered from chromosomes 1 to 22 (left to right).