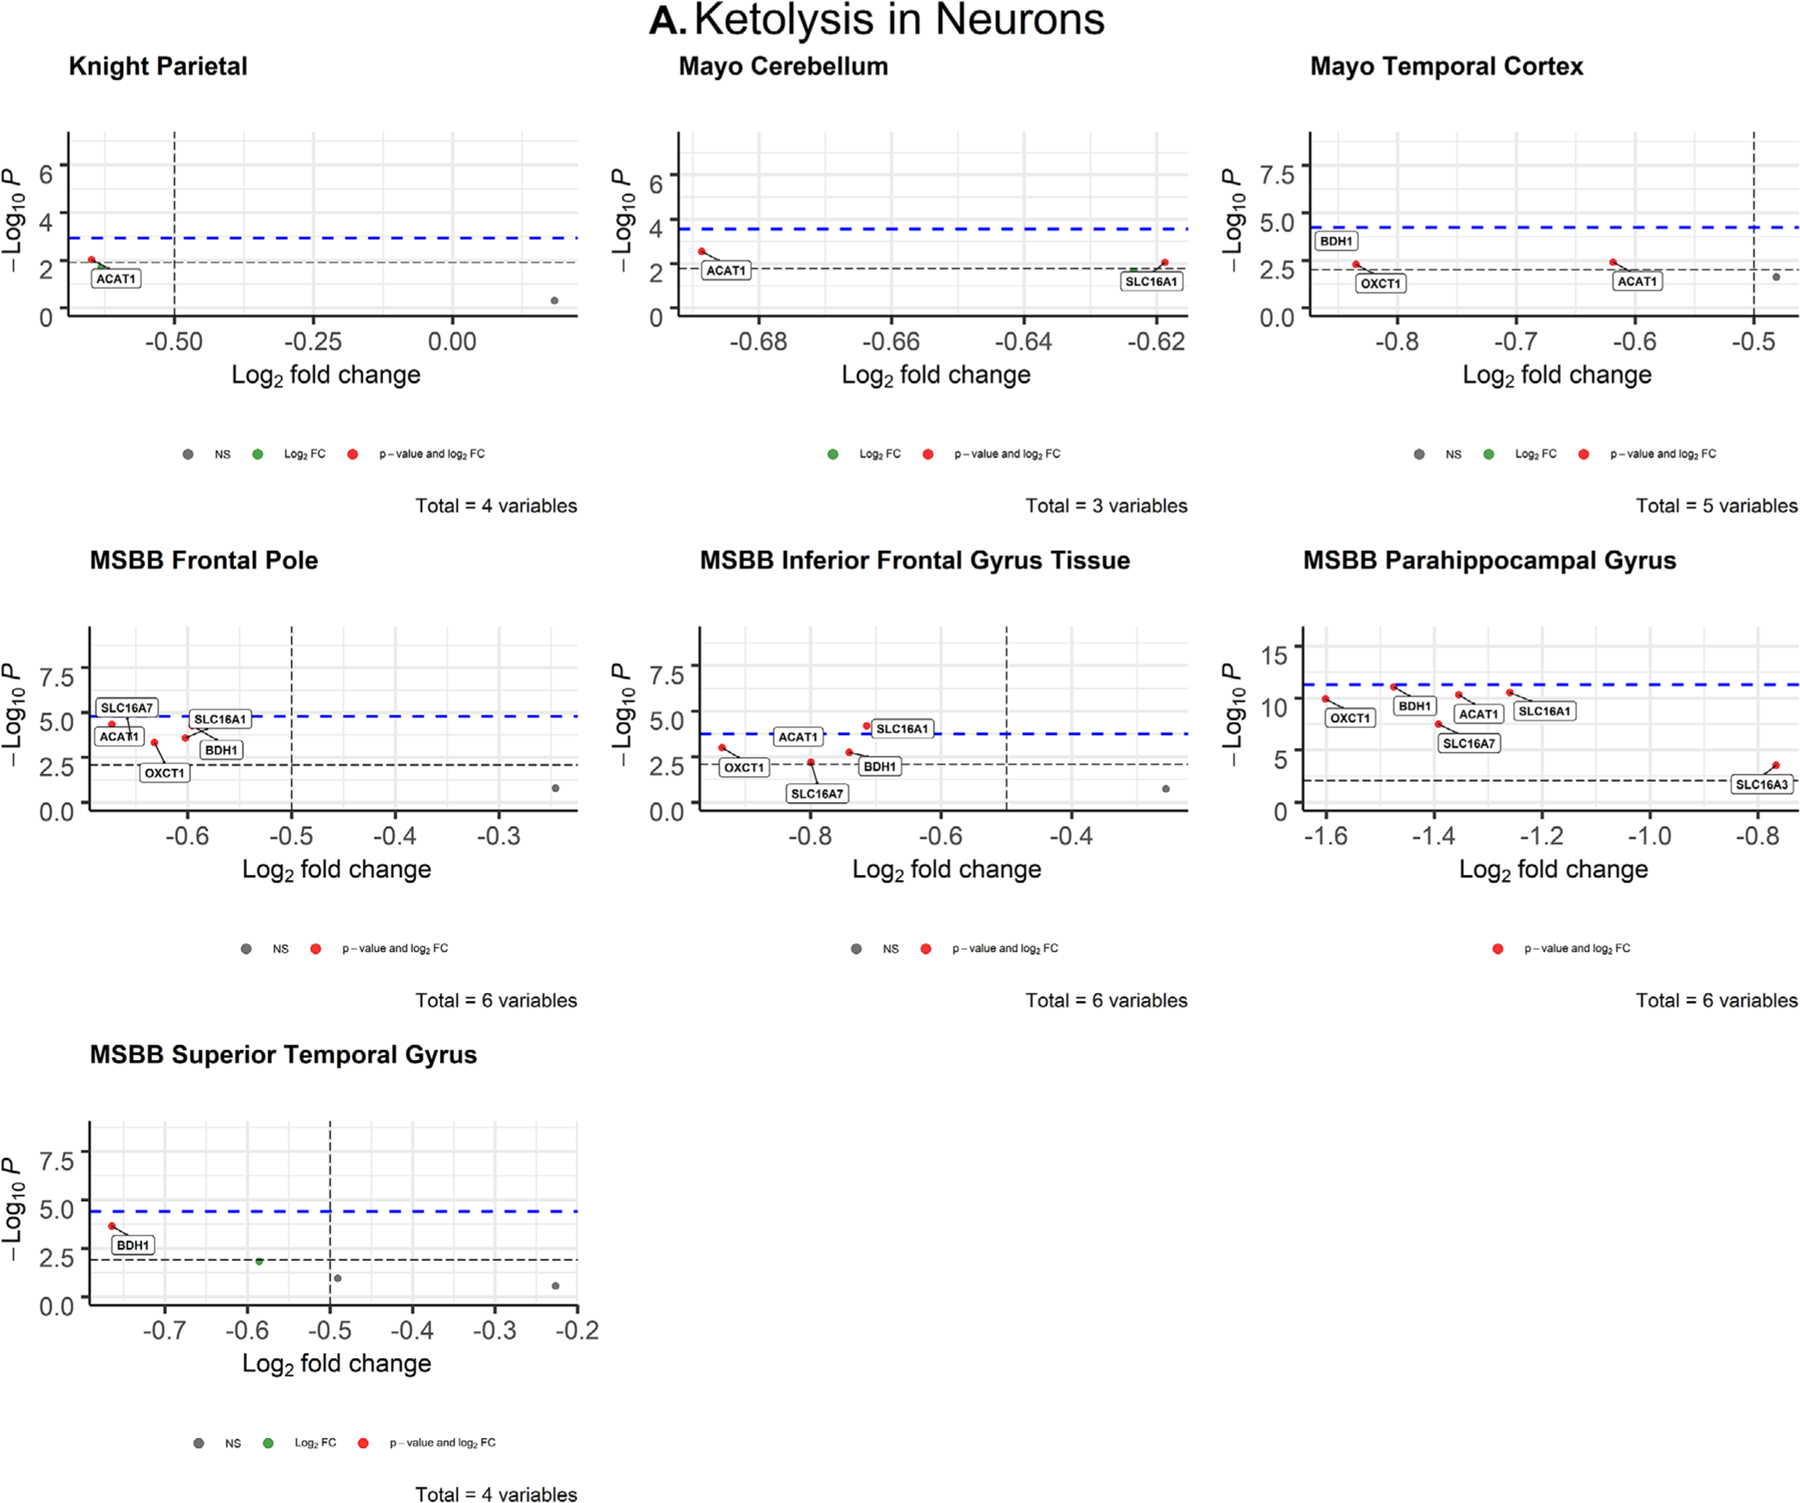
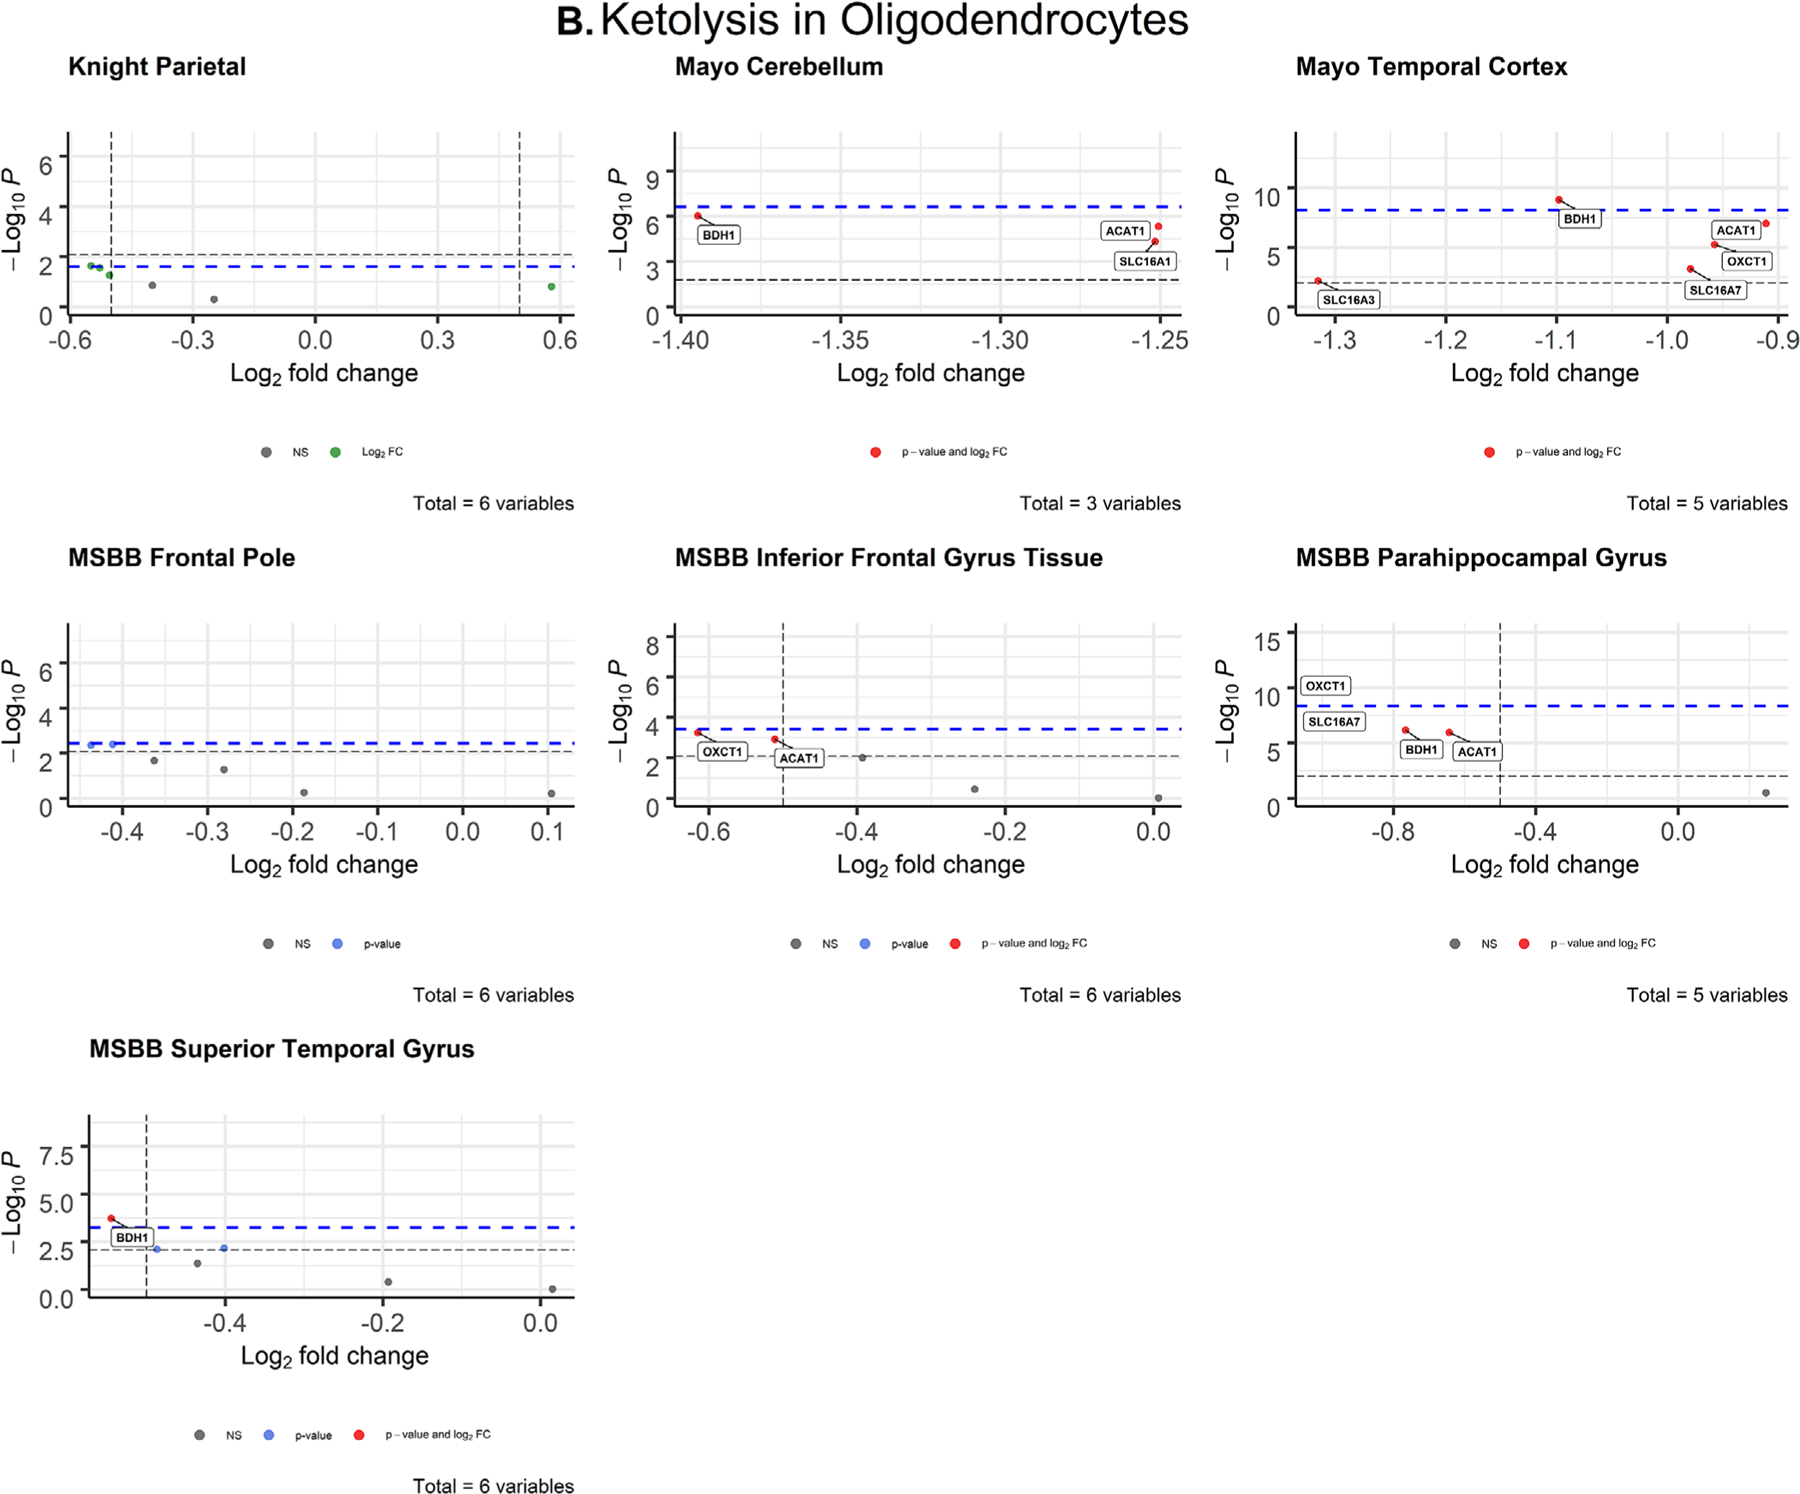
FIGURE 4.


Volcano plots of ketolytic gene expression from Alzheimer’s disease patients in neurons (A) and oligodendrocytes (B) from each dataset. The -log10 P-values of genes are plotted versus the log2FoldChange along the X-axis. Bonferroni-corrected α-values are indicated by the black dashed line and the empirical P-values are indicated by the blue dashed line. Genes with P-values below either cutoff are plotted above their respective cutoff lines, marked in red, and labeled
