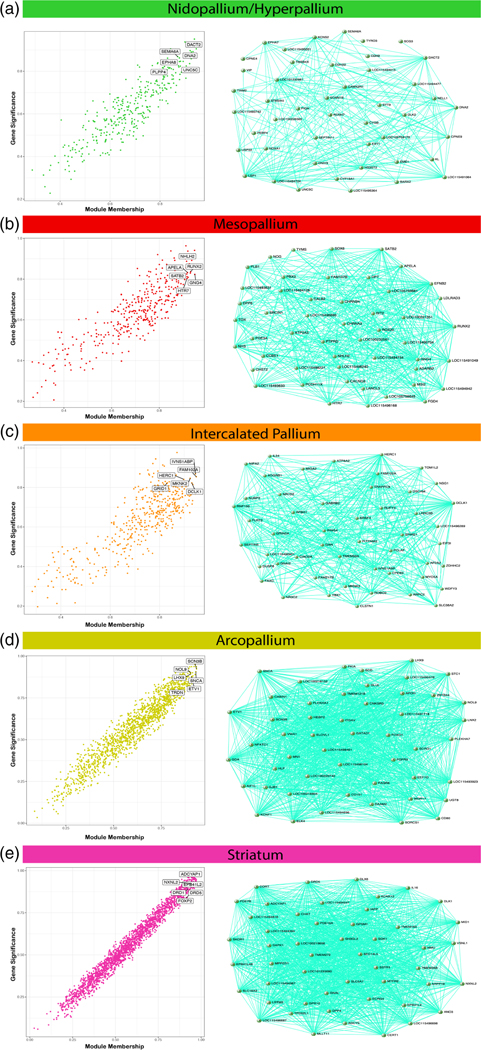
FIGURE 10.
Hub gene identification and top 50 hub gene networks reveal best candidates for subdivision specific expression regulation. (a–e) Correlation between module membership (MM) and gene significance (GS) for the (a) dorsal/ventral mesopallium, (b) nidopallium/hyperpallium, (c) intercalated pallium, (d) arcopallium, and (e) striatum modules. Highlighted are example hub genes with MM > 0.80 and GS > 0.80. The top 50 hub genes and their connections are visualized adjacent to each subdivision-specific module correlation plot. The genes with the highest connectivity offer prime candidates for key regulators of module expression for each subdivision. A full list of hub genes for each subdivision-specific module can be found in Table S5

