FIGURE 3.
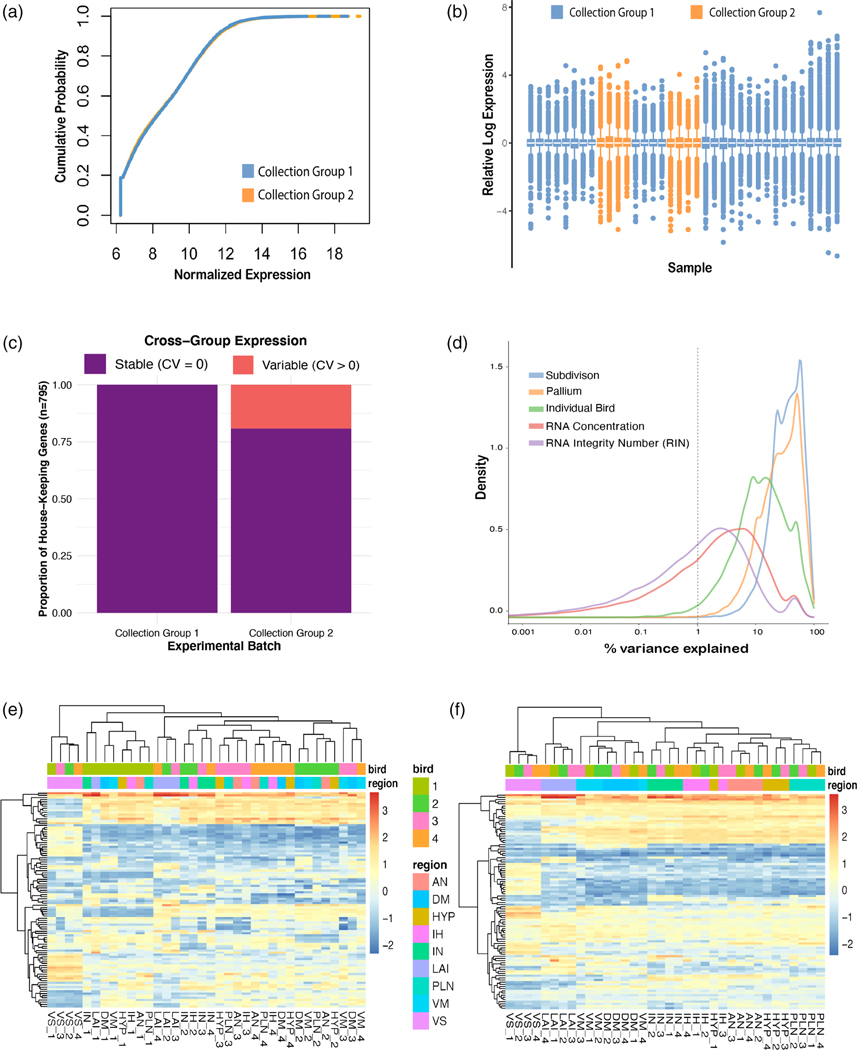
Minimal batch effects detected across collection groups, while individual bird is a strong source of unwanted variation. (a) P–P plot of normalized expression from collection Group 1 (all nonintercalated samples) versus collection Group 2 (intercalated samples). The distributions look nearly identical. (b) Relative log expression plot of all samples colored by collection group. There is no evidence of a systematic shift in global expression in any sample. (c) Proportion of stable house-keeping genes (coefficient of variance [CV] = 0) across the collection groups. (d) Density plot of variance explained by individual variables. Note brain subdivisions (blue line) and broader pallium subdivisions (orange line) together explain most of the variance seen in the data, individual bird (green line) accounts for a nontrivial amount of variance, and RNA concentration and RNA Integrity Number (RIN) have little effect. (e) Heatmap of normalized expression of top 100 most variable genes. Regions cluster mostly by bird (top color bar) rather than brain subdivisions regions (bottom color bar). (f) After accounting for the bird effect as a covariate, these same genes exhibit robust clustering by brain region (bottom color bar)

