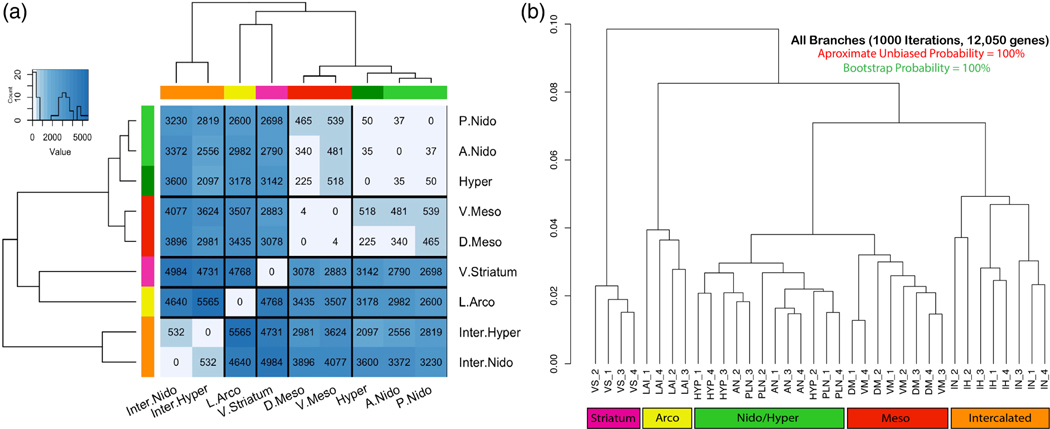
FIGURE 5.
Molecular relationships between brain subdivisions. (a) Dissimilarity heatmap with cluster dendrograms of all differentially expressed genes in pairwise analyses of all brain subdivisions profiled. Heatmap is colored according to number of genes that are significantly differentially expressed at a false discovery rate (FDR) < 0.05. The leaves of the tree are colored and labeled according to the continuum hypothesis, which reflects their clustering patterns. (b) Hierarchical clustering with approximate unbiased (au, red) and bootstrap probability (bp, green) p-values for all differentially expressed genes (n = 12,050) across all samples. All approximate unbiased (au, red) and bootstrap values were 100% for all branches. See Figure 2 for brain region abbreviation list; numbers next to the abbreviations are individual birds

