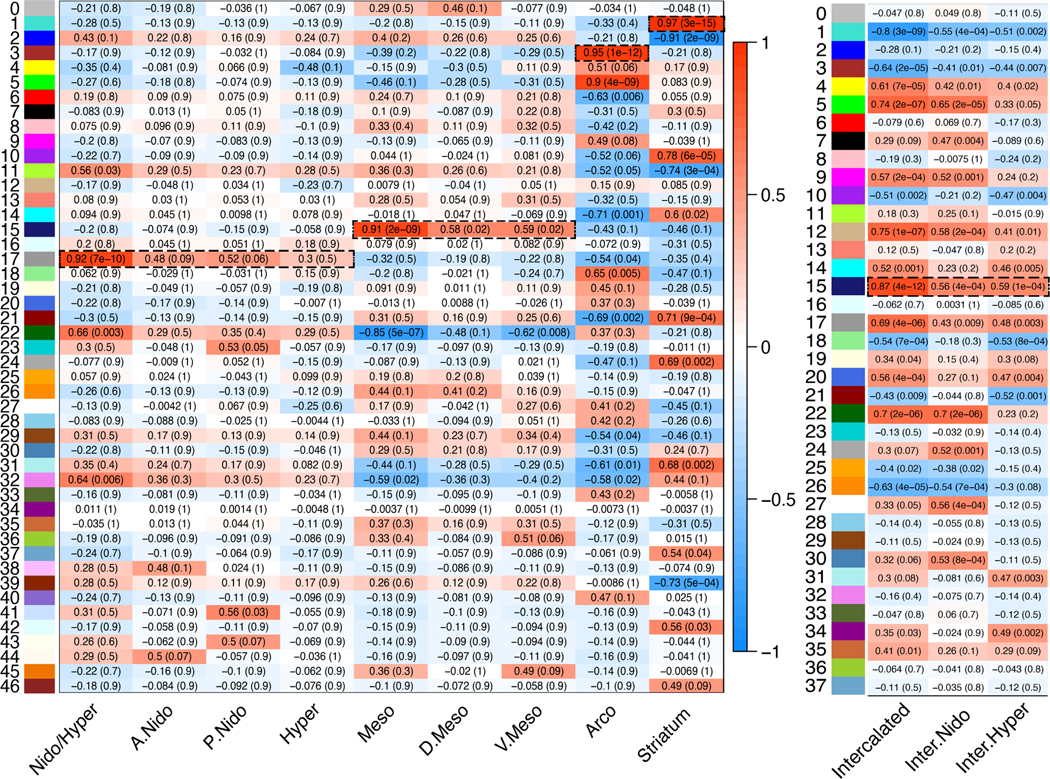
FIGURE 8.
Statistical correlation results of all gene module co-expression networks. (a) Module eigengene vectors and subdivision correlations with intercalated pallium regions excluded. The 47 subnetworks in the gene expression data are identified with unique module number and color (left), as in Figure 7(b). Entries show Pearson correlation and associated corrected q-value (parenthesis), testing for statistical relationships between each module eigengene to a unique subdivision or combination of subdivisions. Color scale indicates strength of positive or negative correlation. Dashed boxed regions highlight strong (r2 > .9) and highly significant (p < .0001) correlations. (b) Module eigengene vectors and subdivision correlations with intercalated pallium regions included. The 38 subnetworks in the gene expression data are identified with unique module number and color (left), as in Figure 7(d); only results for the intercalated regions are shown. Dashed boxed regions highlight strong (r2 ~.9) and highly significant (p < .0001) correlations

