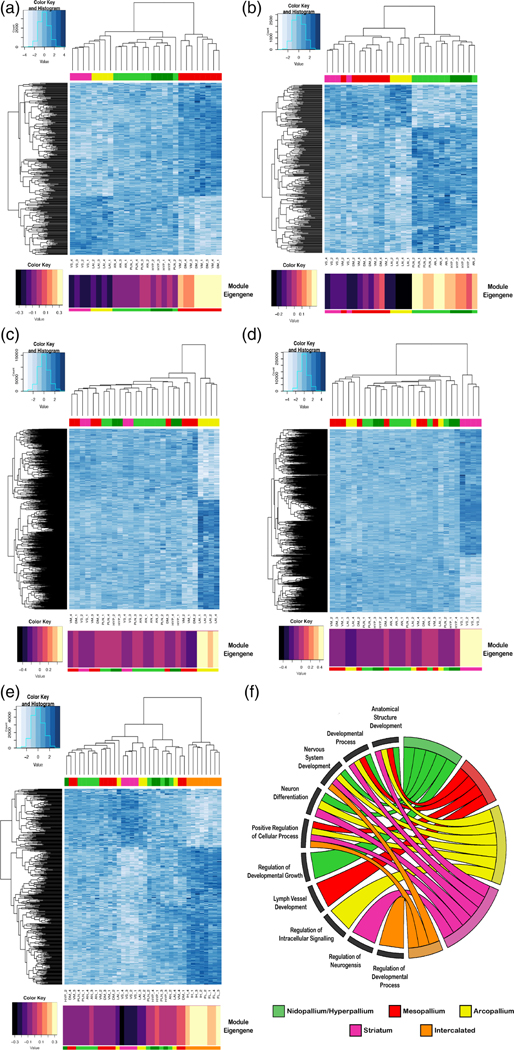
FIGURE 9.
Gene expression module profiles specific to each major avian telencephalic subdivision and combinations of subdivisions profiled. (a–e) Heatmaps of gene expression for subdivision-specific modules. All module specific genes (rows) are plotted; degree of blue indicates level of median scaled gene expression for all module genes. To the left is the gene expression tree dendrogram; at the top is the brain region dendrogram relationships for each sample color coded by pallial identity. At the bottom is module eigengene value for each subdivision module; the larger the number (or lighter color), the stronger the relationship of that sample to the module eigengene. (a) Mesopallium-specific (MV, MD; red) module (15, nGene = 363). There is a strong anticorrelation between this module’s genes and the arcopallium and striatum. (b) Nidopallium (PLN, AN; light green) and hyperpallium (HYP; dark green) specific module (17, nGene = 335). (c) Arcopallium (LAI) specific module (3, nGene = 1501). (d) Striatum (VS; maroon) specific module (1, nGene = 2239). (e) Intercalated-specific (IH, IN; orange) specific module (15, nGene = 442). (f) Chord diagram of significant GO terms for each neural subdivision module. Each subdivision module contains specific functional enrichments (bottom left quadrant), as well as substantial overlap in function for nervous system development and neuron differentiation (top left quadrant). A list of the most significant GO terms can be found in Table 3, with a complete list in Table S3(a–d) and Table S4(e)

