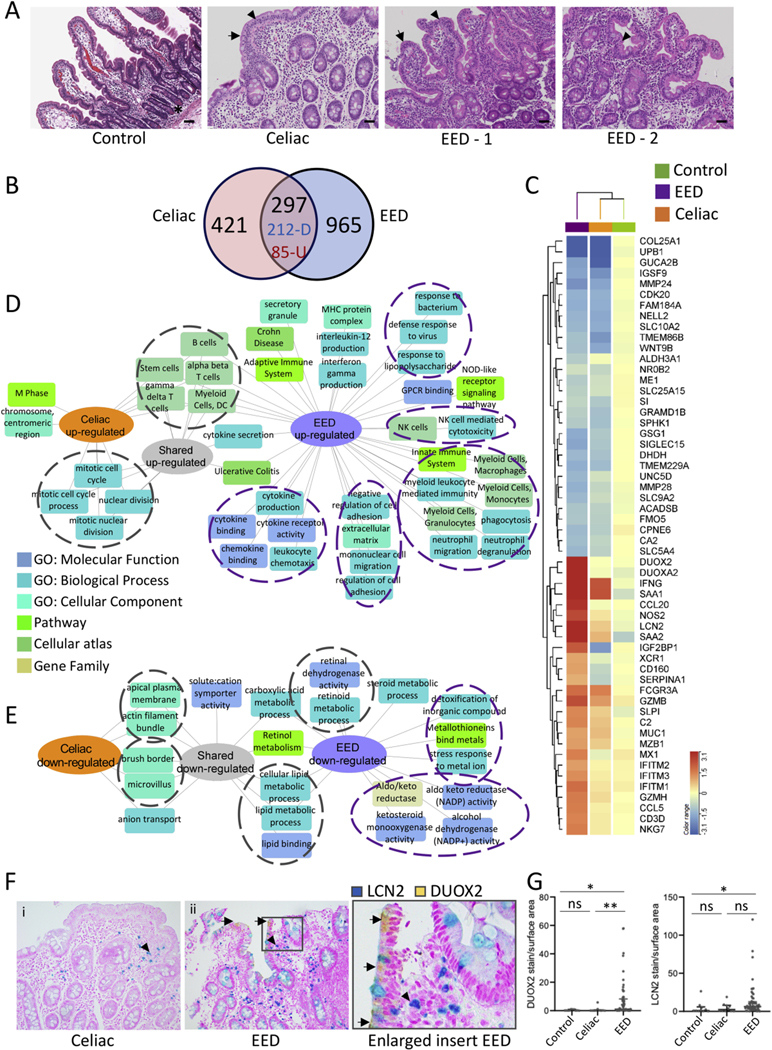
Figure 2.
Shared and disease-specific immune and metabolic intestinal gene expression features of EED and celiac disease. (A) Representative hematoxylin and eosin stained duodenal biopsy specimens from a Cincinnati well-nourished control, a Cincinnati celiac disease patient (Marsh celiac disease score 3a; EeD histology score of 12), a malnourished AKU-EED-1 case with EED histology score of 9, and a malnourished AKU-EED-2 case with EED histology score of 4 are shown. *Paneth cells in a Cincinnati well-nourished control. Arrow indicates villous blunting and arrowhead indicates intraepithelial lymphocytes in a patient from Cincinnati with celiac disease and a malnourished AKU-EED case. Bar equals 247 μm. (B) The Venn diagram shows the overlap between the 718 genes comprising the celiac disease transcriptome (differentially expressed genes between 17 patients from Cincinnati with celiac disease and 25 well-nourished controls from Cincinnati, FDR < 0.05 and fold change [FC] ≥ 1.5 using bulk RNASeq of duodenal RNA) and 1,262 genes comprising the EED transcriptome. This demonstrates 212 shared down- and 85 shared up-regulated genes. (C) Unsupervised hierarchical clustering heatmap with the top differentially expressed genes in the EED transcriptome demonstrating the averaged normalized expression across malnourished aKu-EED cases, patients from Cincinnati with celiac disease, and Cincinnati well-nourished controls. Functional enrichment analysis of the up- (D) and down-regulated (E) shared and unique genes in the EED and celiac disease transcriptomes was performed using ToppGene/ToppCluster34 and was visualized using Cytoscape.35 (F) Immunohistochemistry was performed using antibodies against DUOX2 (yellow chromogen) and LCN2 (teal chromogen) in a dual stain. Original magnification x200 for i & ii. (G) Data for the relative tissue area exhibiting staining for the analytes, normalized against the total area of tissue in each sample, are shown for controls (n = 10), celiac disease (n = 10), and EeD (n = 57); Kruskal-Wallis test with Dunn multiple comparisons test; **P < .01; *P < .05.

