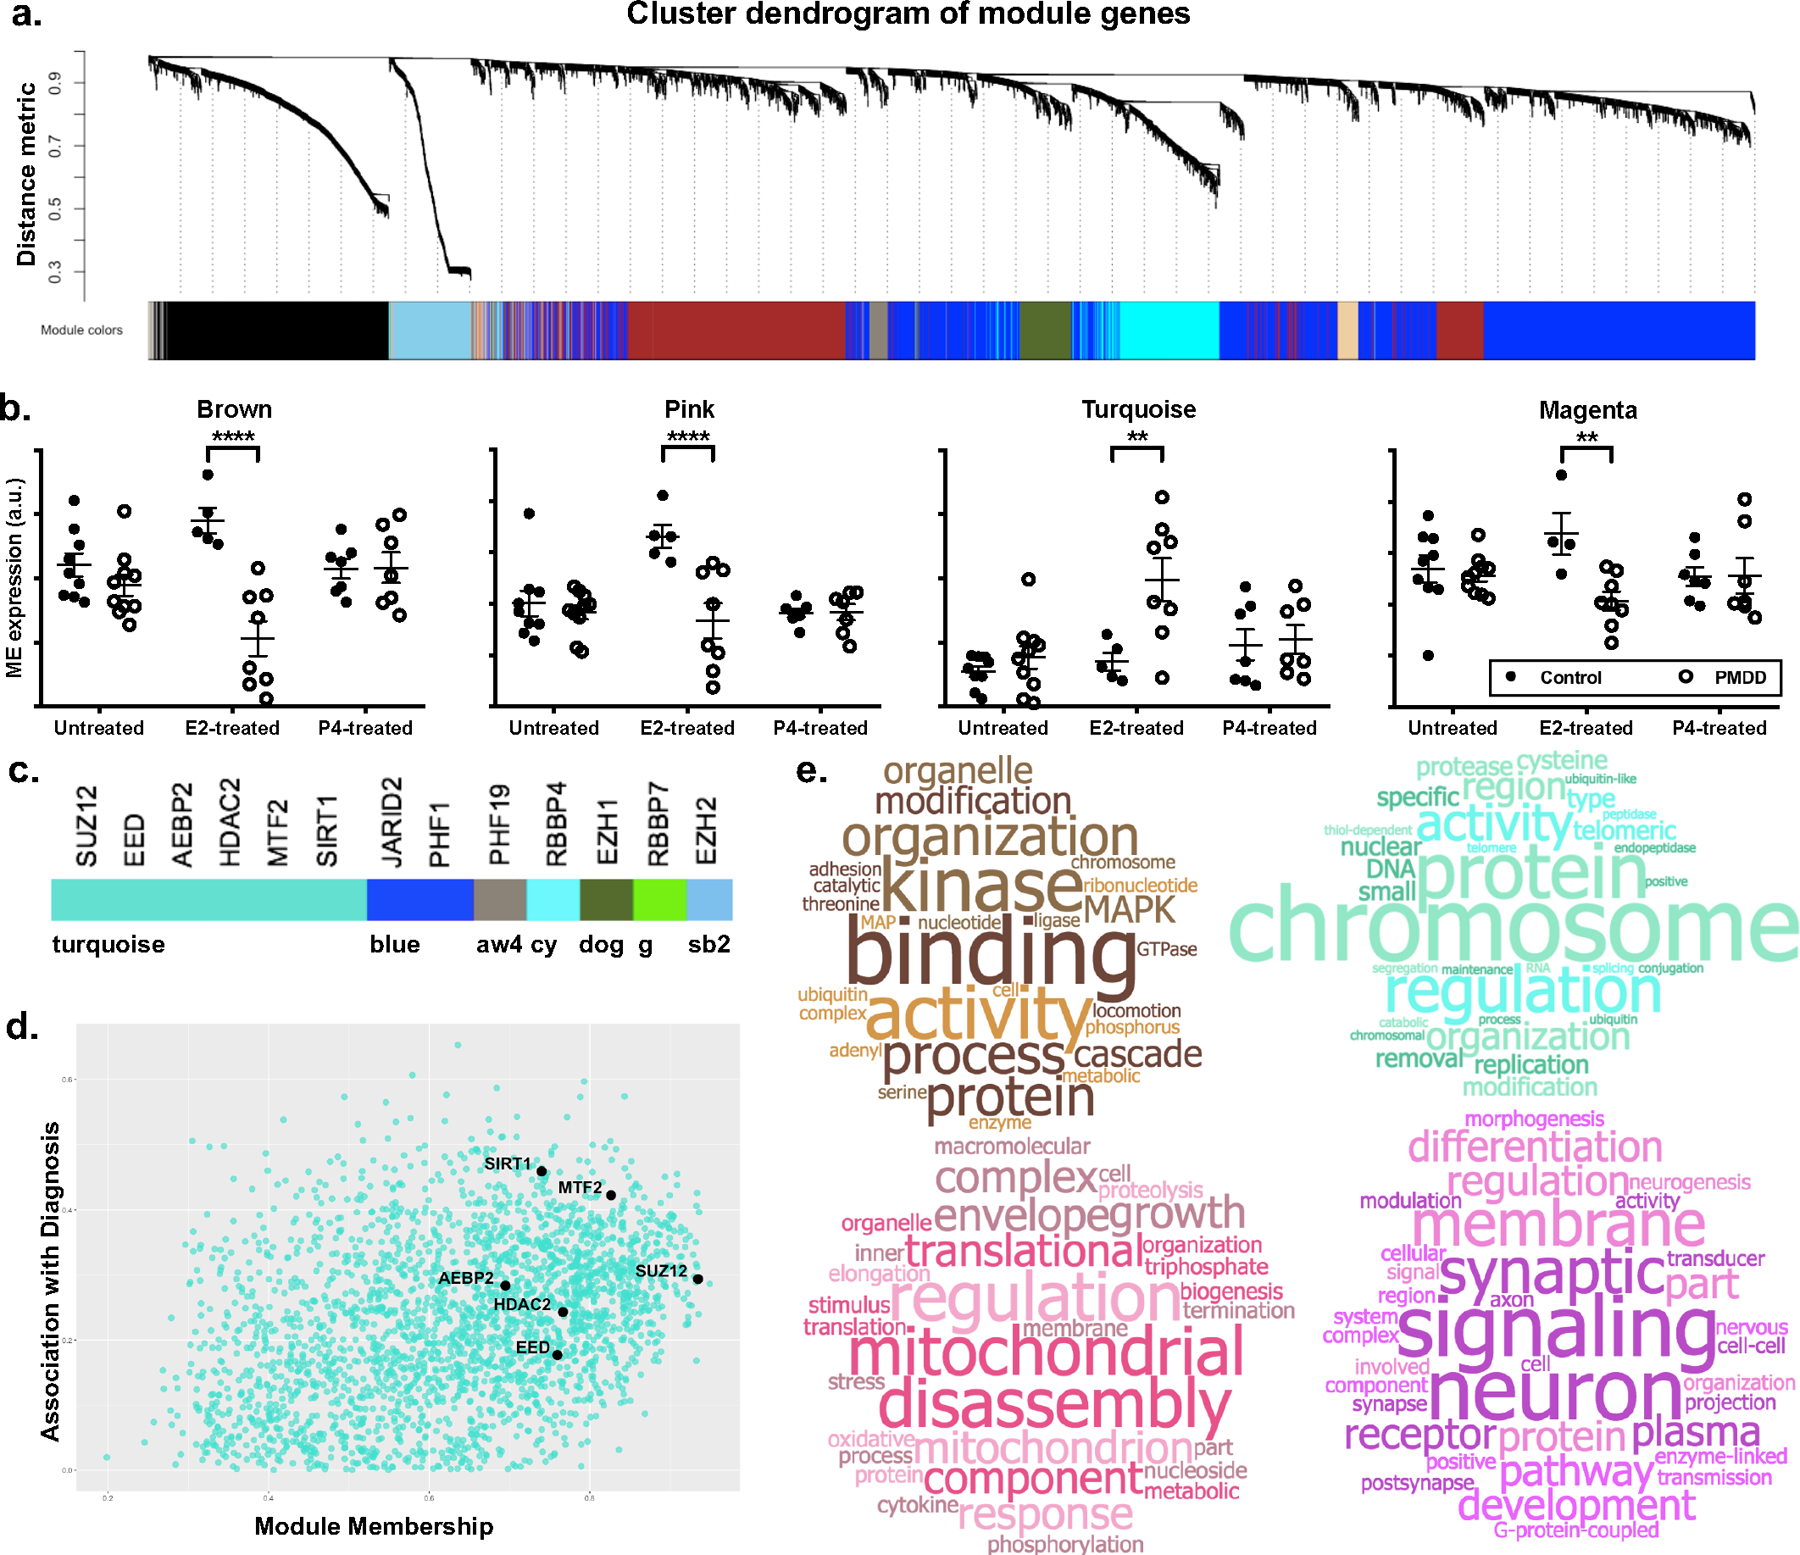
Figure 1. Functional analysis of gene modules from hormone-exposed PMDD LCLs.

a. Cluster dendrogram of gene modules. In WGCNA analysis of 46 input transcriptomes, 21 746 unique gene features (“genes”) were clustered into 65 co-expression modules using gene-gene correlation patterns across all input transcriptomes.
b. Module eigengenes showing significant diagnosis x hormone interactions. Eigengenes (defined as the first principal component of a given module) of four modules (Brown, Pink, Turquoise, and Magenta) showed differential regulation by hormone (ANOVA Interaction P < 0.05). Closed circles denote controls. Open circles denote PMDD. Note: An extreme outlier in the E2-treated control group was excluded in the eigengene plot of the Magenta module for scaling purposes. Hormone x diagnosis interaction was significant both before and after exclusion of this outlier. P-values are not adjusted for multiple comparisons.
c. Module membership of ESC/E(Z) complex genes. Nearly half (6/13) of ESC/E(Z) complex genes were assigned to the Turquoise module. Remaining ESC/E(Z) genes were clustered into the Blue, AntiqueWhite4 (aw4), DarkOliveGreen (dog), Cyan (cy), Green (g), and SkyBlue2 (sb2) modules.
d. ESC/E(Z) complex genes in the Turquoise module. Genes plotted according to module membership and strength of association with diagnosis. ESC/E(Z) complex genes (SUZ12, EED, AEBP2, HDAC2, MTF2, SIRT2) are more likely to have high module membership within the Turquoise module.
e. Word cloud representations of GSEA results. Top 20 GSEA results were used to generate word clouds for each differentially regulated module. Word size is proportional to frequency of word among GO terms identified by GSEA results. Modules were enriched for terms relating to MAP Kinase and GTPase signaling (Brown, top left), chromatin remodeling and proteasome function (Turquoise, top right), mitochondrial function (Pink, bottom left), and neuronal and synaptic function (Magenta, bottom right). Full, quantitative GSEA results are tabulated in Supplemental Table S3. Word clouds generated via worditout.com.
