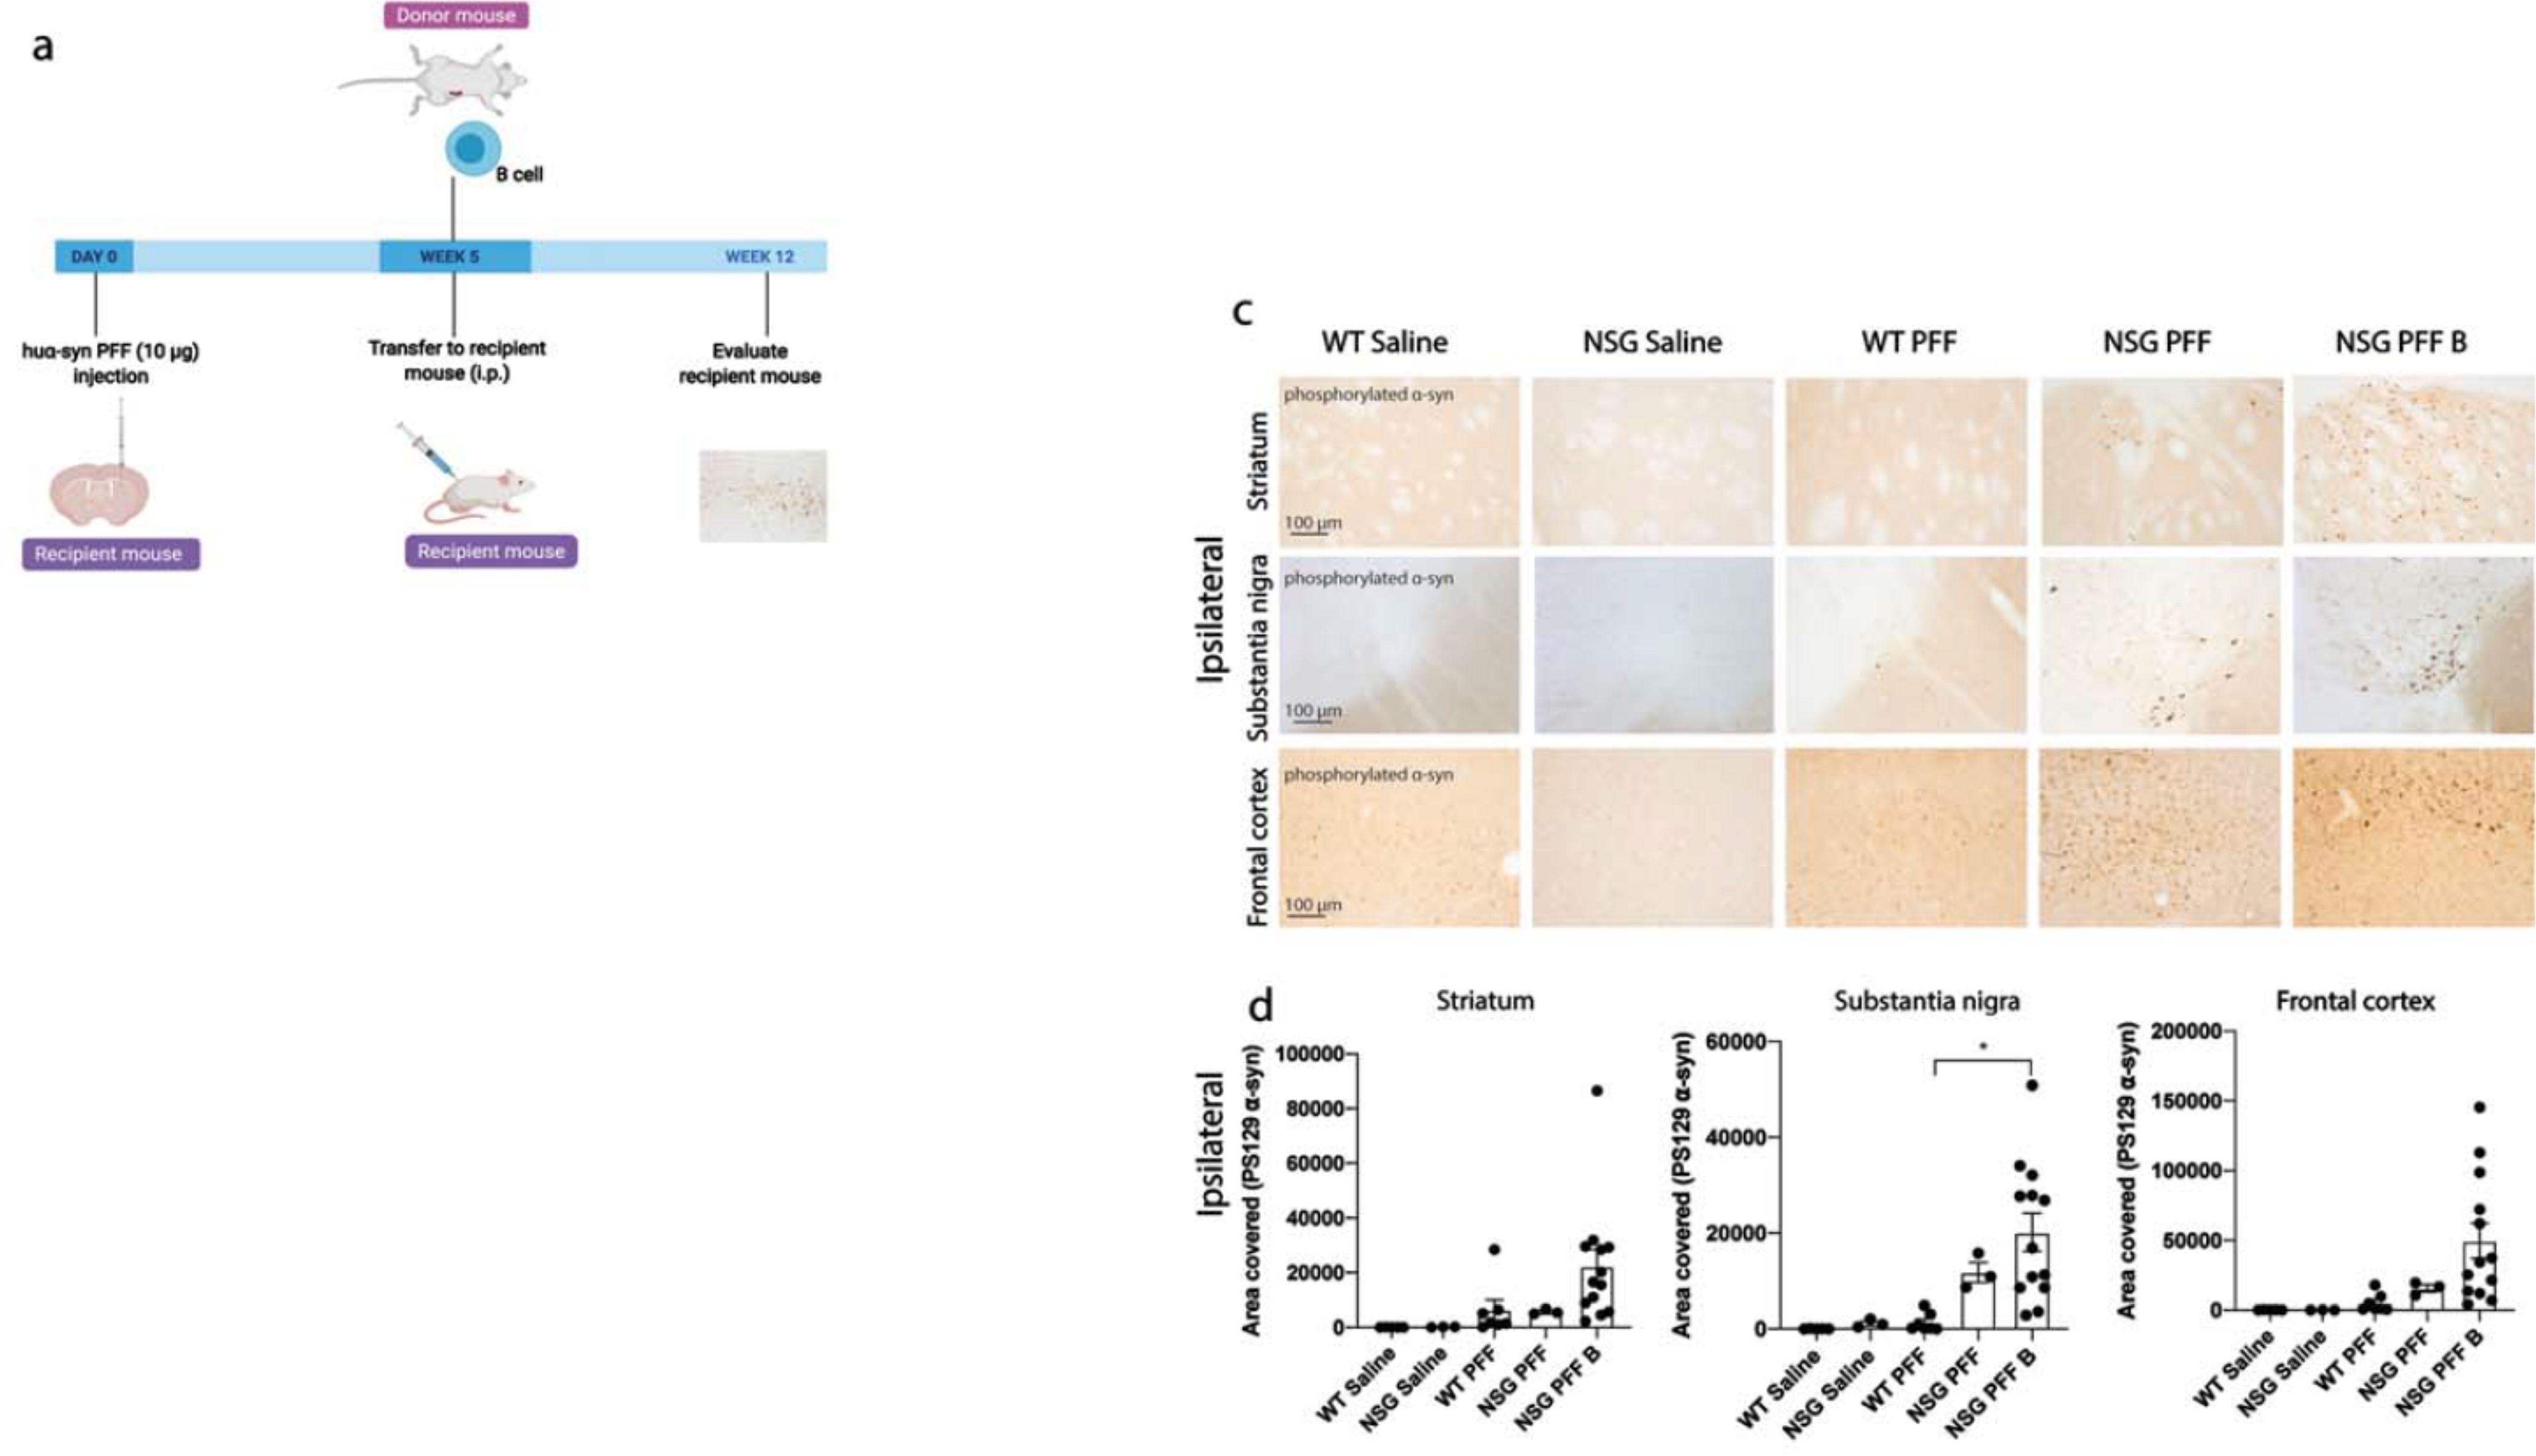
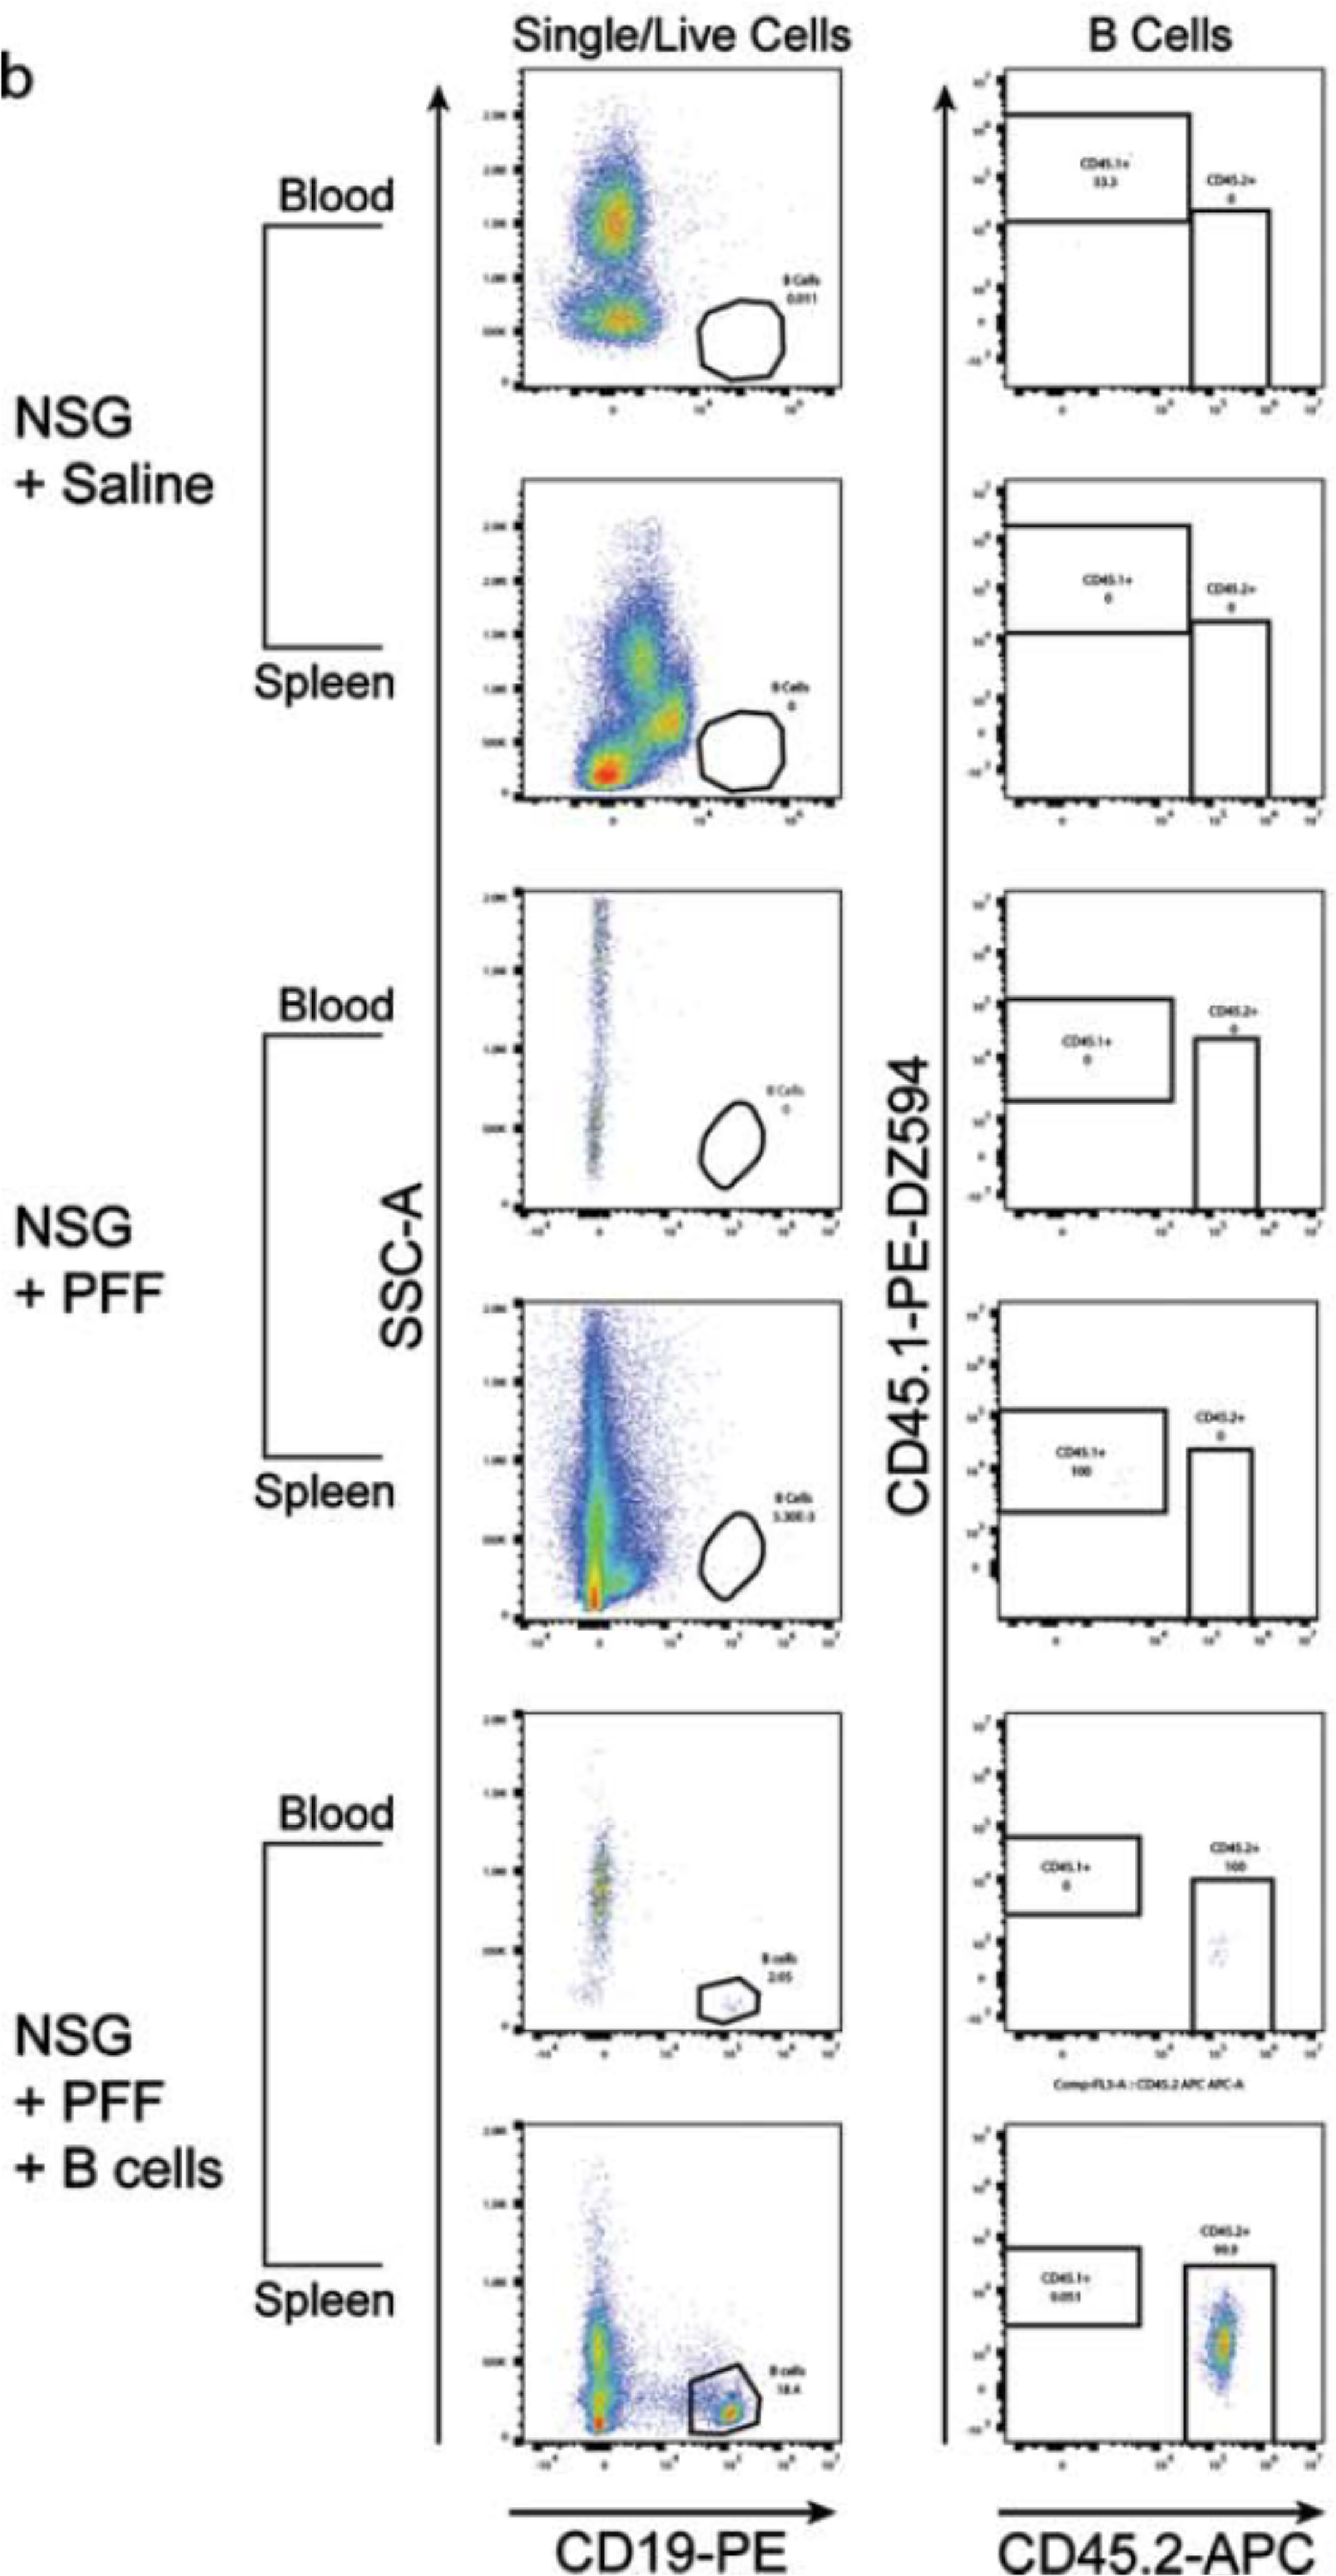
Figure 3. Adoptive transfer of B cells alone did not alter phosphorylated α-syn pathology in immunocompromised mice.


a. Timeline of experiment. b. Flow cytometric analysis of mouse spleen and blood following adoptive transfer demonstrated that wildtype mice contain populations of T and B cells that are CD3 and CD19 positive. NSG mice do not have T and B cell populations. Following adoptive transfer of B cells, NSG mice contained CD45.2+ CD19+ B cells. Representative plots are shown for each treatment condition. c. Phosphorylated α-syn was detected in the ipsilateral striatum, substantia nigra and frontal cortex. d. Densitometry of 3–9 mice per group to determine the area covered in phosphorylated α-syn levels in the ipsilateral striatum, substantia nigra and frontal cortex. Wildtype Saline, n = 5; NSG Saline n = 3, wildtype PFFs, n = 3; NSG PFFs, n = 3; NSG PFF B n = 12). The error bars represent S.E.M. Statistical analyses were performed by Kruskal-Wallis test * p < 0.01. Scale bar: 100 μm. Schematic created with BioRender.com
