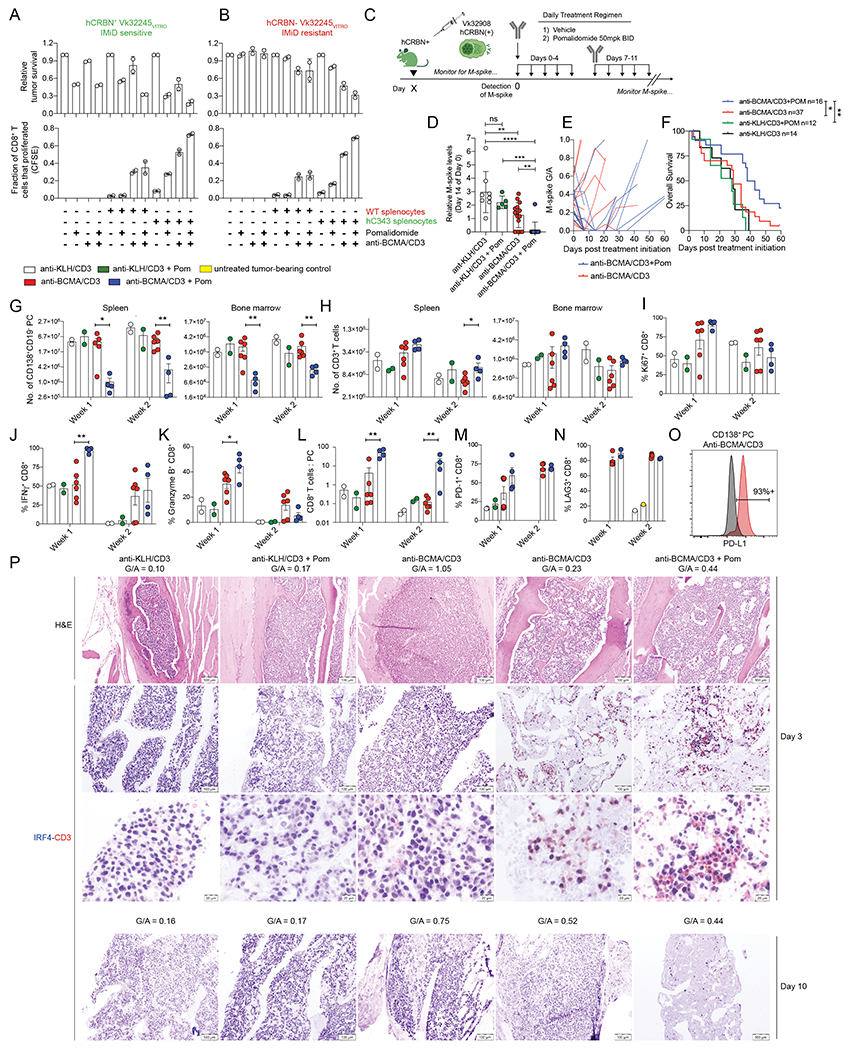
Figure 4. Tumor-and T cell-autonomous Pom effects enhance and BCMA/CD3 activity.

The cell viability by FCM of Vk32245VITRO MM cells transduced with A. hCRBN expressing lentivirus or empty control B. co-cultured in vitro with splenocytes from WT- or hC343 mice and exposed to anti-BCMA/CD3 with or without Pom is shown on top panels, normalized to the untreated conditions. Representative of three independent experiments. Below, the proliferation of CD8+ T cells from the conditions in (A) were quantified by dilution of cytoplasmic CFSE and measured by FCM. Bar graphs indicate the fraction of total cells that proliferated (1 = 100%). Error bars are the SEM of triplicate values. C. Treatment schematic for hC343 recipient mice bearing IMiD sensitive Vk32908 MM cells. D. M-spike levels (% of day 0) in Vk32908 tumor bearing mice measured 14 days after treatment initiation. Each dot represents the M-spike from an individual mouse. Bars show mean with SD. P values derived from unpaired nonparametric T tests. E. M-spike (G/A) of individual mice measured over time after treatment initiation. F. Kaplan-Meier survival plot in days from the initiation of treatment of Vk32908 tumor bearing hCRBN+ mice receiving treatments in (B). P values derived from Mantel-Cox Log-ranked Chi-square test. Bar graphs summarizing Vk32908 tumor cells (G), or T cells (H) quantified by FCM in the SPL and BM of mice in C, three or ten days after treatment initiation. Each dot represents an individual mouse. Bar graphs of the percentage of Ki67+ (I), IFN-γ+ (J) and granzyme B (K) CD8+ splenic T cells as well as the CD8+ T cell to tumor cell ratio in the SPL(L). Percentage of PD-1+ (M), and LAG3+ (N) CD8+ T cells from splenocytes. O. PD-L1 expression by FCM in Vk32908 MM cells from a representative mouse treated with anti-BCMA/CD3, ten days after treatment initiation. Black histogram represents FMO control staining. P. BM sections from mice necropsied three days (1st-3rd row) or ten days (4th row) after treatment initiation in C, stained with H&E or antibodies to CD3 in red and IRF4 in blue. G/A ratio at beginning of treatment is indicated above each image. Two examples of mice treated with anti-BCMA/CD3 are shown: low and high initial M-spike. Scale bar indicates the magnification Unpaired T test *P < 0.05; **P < 0.01; ***P < 0.001; ****P < 0.0001.
