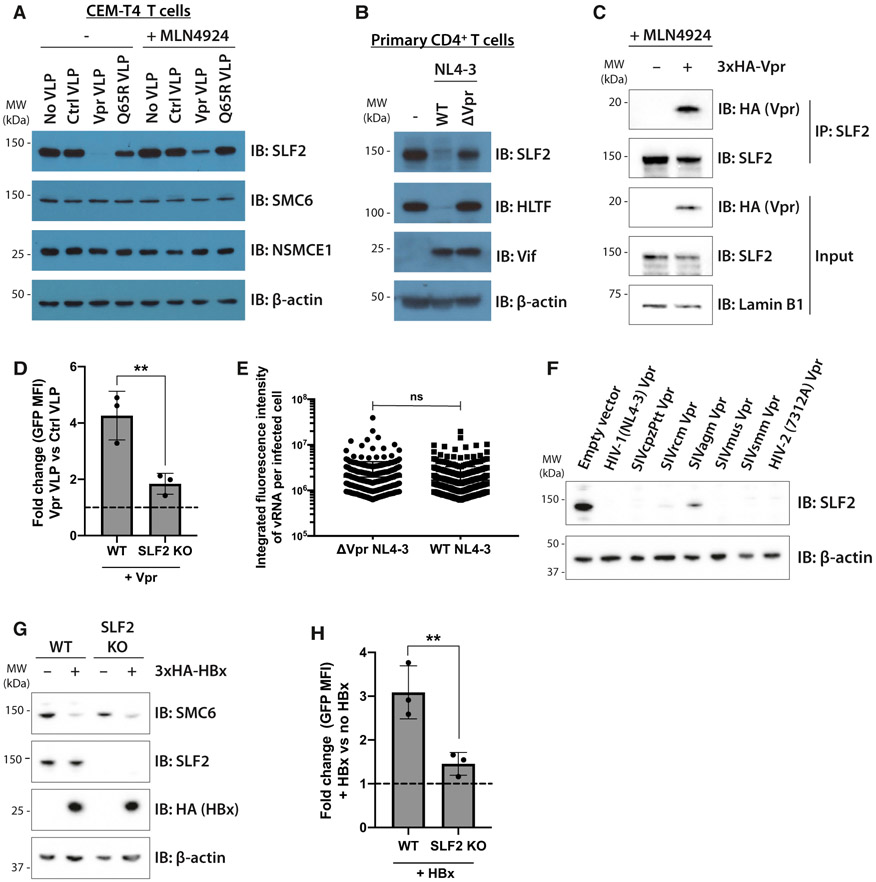
Figure 4. Unintegrated lentivirus restriction by the SMC5/6 complex is antagonized by viral accessory proteins Vpr and HBx.
(A and B) Endogenous SLF2 is depleted by HIV-1 Vpr.
(A) CEM-T4 T cells were transduced with control VLP, Vpr VLP, or Q65R Vpr VLP, with or without 1-μM MLN4924. Cell lysates were harvested 24 hpi and analyzed by immunoblotting.
(B) Primary CD4+ T cells were infected with WT or ΔVpr NL4-3LNGFR. 48 hpi, infected cells were enriched by AFMACS and lysates analyzed by immunoblotting.
(C) SLF2 interacts with 3xHA-Vpr. CEM-T4 T cells were preincubated with 1-μM MLN4924 and transduced with 3xHA-Vpr. 24 hpi, nuclear extracts were immunoprecipitated with an SLF2 antibody and analyzed by immunoblotting.
(D) SLF2 KO reduces Vpr effect on unintegrated virus expression. Unintegrated virus reporter assay in WT or clonal SLF2 KO cells co-transduced with control or Vpr VLPs. Flow cytometry 48 hpi (n = 3), quantified as fold change in GFP MFI upon addition of Vpr versus control VLPs.
(E) vRNA levels are unchanged upon Vpr deletion in SLF2 KO cells. Clonal SLF2 KO cells were infected with WT or ΔVpr NL4-3GFP reporters in presence of RAL. vRNA was detected by in situ hybridization 48 hpi and quantified as previously described. Representative data of n = 2.
(F) Vpr ability to degrade SLF2 is evolutionarily conserved. Jurkat T cells were transduced with primate lentiviral Vpr constructs, and Vpr-expressing cells isolated by GFP+ FACS 48 hpi followed by immunoblotting of lysates. Representative blot (n = 2).
(G and H) HBV HBx rescues gene expression from unintegrated lentiviral reporters.
(G) WT or SLF2 KO Jurkat cells were transduced with 3xHA-HBx, puromycin selected, and lysates analyzed 96 hpi by immunoblotting. Representative blot (n = 3).
(H) Unintegrated virus reporter infection of WT and SLF2 KO cells ± 3xHA-HBx, flow cytometry 72 hpi. Data quantified as fold change in GFP MFI upon addition of HBx (n = 3). Error bars show standard deviation. ns, p > 0.05; **p < 0.01.
See also Figure S5.

