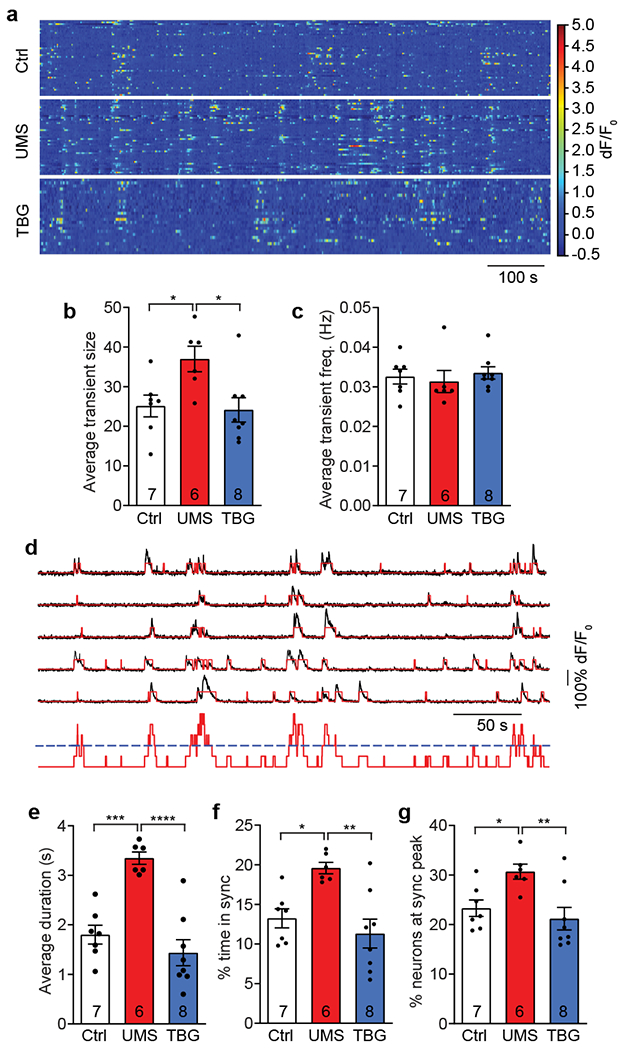
Figure 4. TBG normalizes baseline Ca activities of S1BF L2/3 neurons following UMS.

a, Example of baseline Ca activities of L2/3 neurons. b, Average Ca transient size measured by the sum of dF/F0 (F(2,18) = 5.141, p < 0.05, one-way ANOVA with post hoc Tukey’s multiple comparisons test). c, Average transient frequency (H(3) = 2.333, p = 0.3238, Kruskal-Wallis test). d, Top: example of neurons with diverse activity levels and participating in synchronous events. Black: dF/F0; red: binarized Ca transients. Bottom: sum of binarized Ca transients (red) with threshold for synchrony (blue). e, Average duration of synchronous events (F(2,18) = 20.75, p < 1×10⁻⁴, one-way ANOVA with post hoc Tukey’s multiple comparisons test). f, Average percentage of time during which the neuronal population is in synchrony (F(2,18) = 8.473, p < 0.01, one-way ANOVA with post hoc Tukey’s multiple comparisons test). g, Average percentage of neurons participating in synchronous events (F(2,18) = 6.202, p < 0.01, one-way ANOVA with post hoc Tukey’s multiple comparisons test).
