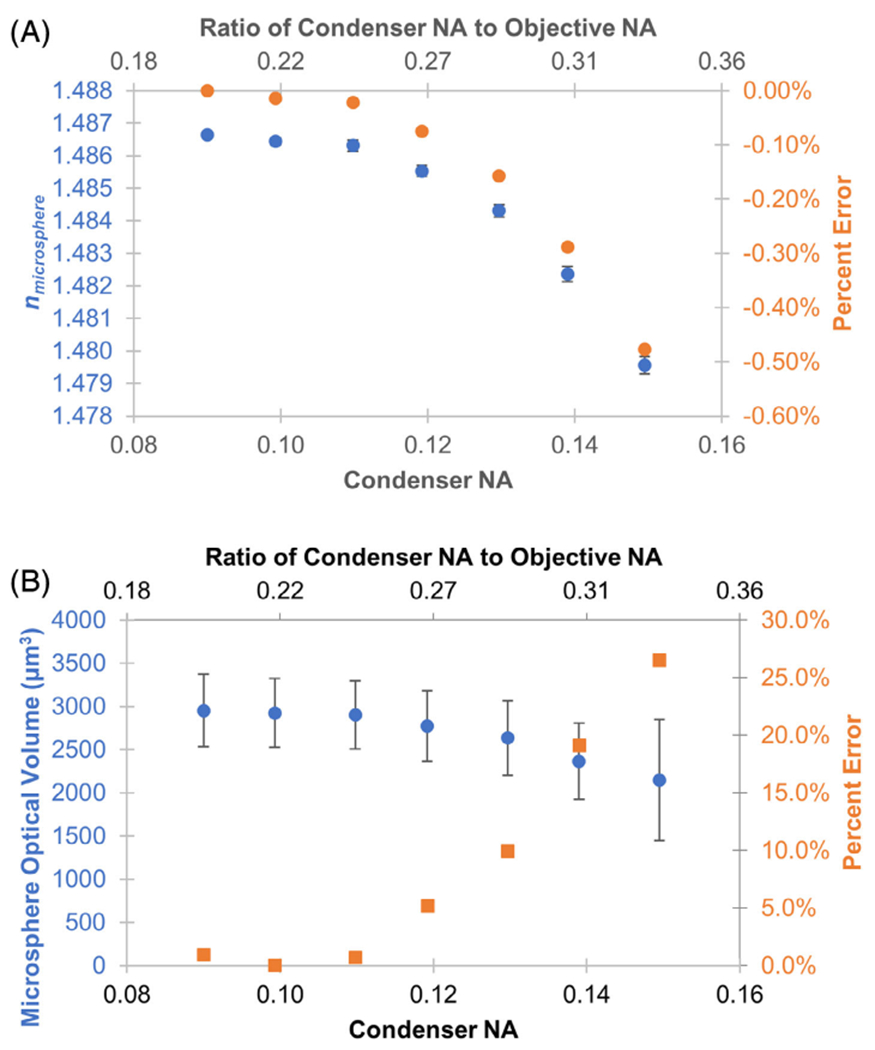
FIGURE 2.

Evaluation of microsphere refractive index (A) and optical volume (B) measured by QPI in response to varying illumination aperture. Microsphere phase image reconstruction was not possible at aperture settings above 0.15. Error bars represent standard error of the mean across 66 microspheres in the image. Percent error of refractive index and optical volume were calculated with respect to the optimal condenser N.A. setting at 0.09 and average microsphere diameter of 67.7 μm
