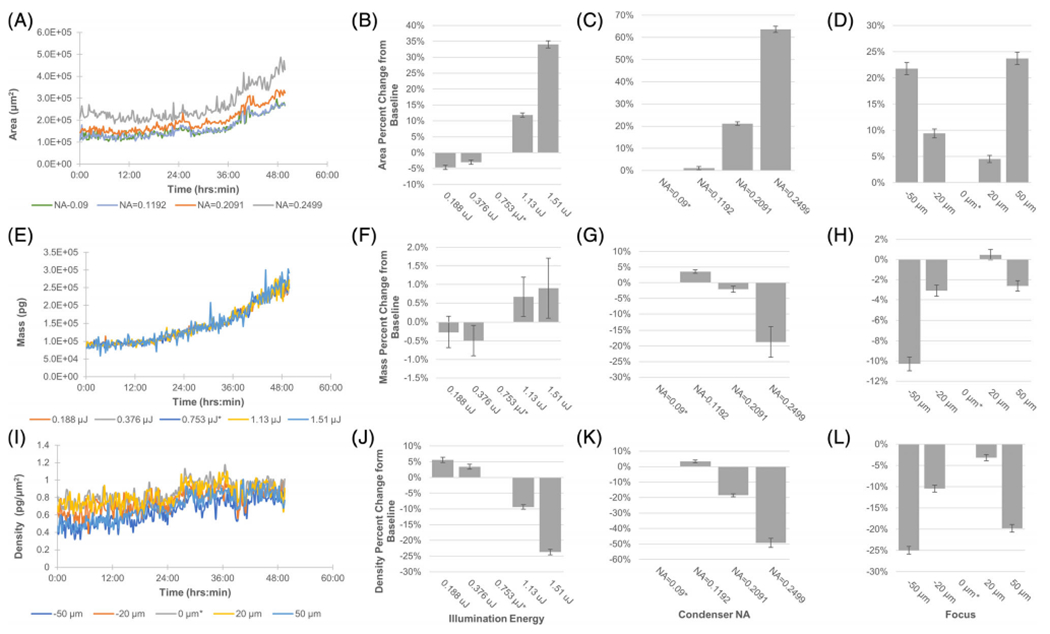
FIGURE 5.

Time lapse imaging of HEK293 under varying QPI acquisition parameters for illumination energy, condenser NA, and focal plane. Analysis performed on 10x field of view. (A) Dynamic cell area measurements with varying condenser NA. (B-D) Area percent change compared to baseline setting. (E) Dynamic cell mass measurements with varying illumination energy. (F-H) Mass percent change compared to baseline setting. I) Dynamic mass density measurements with varying focus. (J-L) Density percent change compared to baseline setting. Standard error of the mean shown in error bars (n = 200 time points). Baseline acquisition condition identified by asterisk (*)
