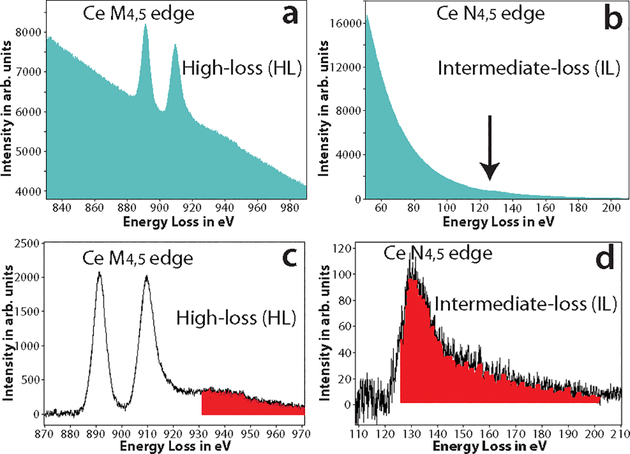
Figure 2.
a) The raw spectrum acquired at the high-loss M4,5 edge of Ce, the two white line peaks with onset ~ 883 eV is clearly visible. b) The raw spectrum acquired at the intermediate-loss N4,5 edge of Ce, edge is barely visible as a small bump in the spectrum (see arrow direction). c) The background subtracted spectrum of (a), the M4,5 edge of Ce has a high signal-above-background ratio (SBR). The red shaded region shows the Ce extended energy-loss fine structure (EXELFS) bleed into the Pr edge. d) The background subtracted spectrum of (b), the N4,5 edge of Ce is now clearly visible, though with a much lower SBR. The red shaded region shows the part of the Ce edge that bleeds into the Pr edge.

