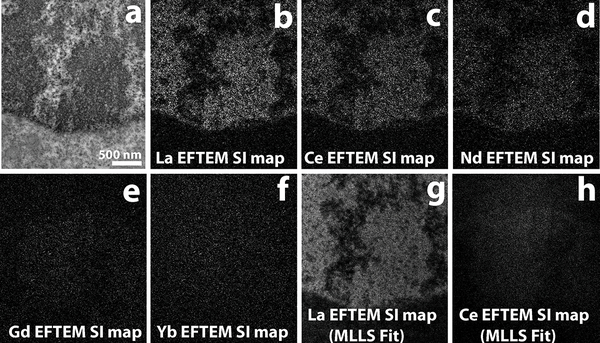
Figure 6.
a) Conventional TEM image of H2B-Nucleosome sample labeled with La2DAB. b) La EFTEM SI map, with strong La signal as expected. c) Ce EFTEM SI map of the same sample indicates that there is significant bleed-through of the La signal into the Ce edge, that gets fainter at the Nd edge (d) and is almost negligible in the Gd edge (e) and Yb edge (f). La (g) and Ce (h) maps computed with the multiple linear least-squares (MLLS) fitting to La and Ce spectra acquired separately. The MLLS sub-routine of Digital Micrograph (Gatan, Inc), is a linear fitting algorithm that can be applied to discriminate overlapping edges. With MLLS fitting, the bleed-through of the La signal into the Ce edge can be effectively removed (h). The MLLS fit was applied to images after binning by 4 (g and h), all other panels are unbinned images.

