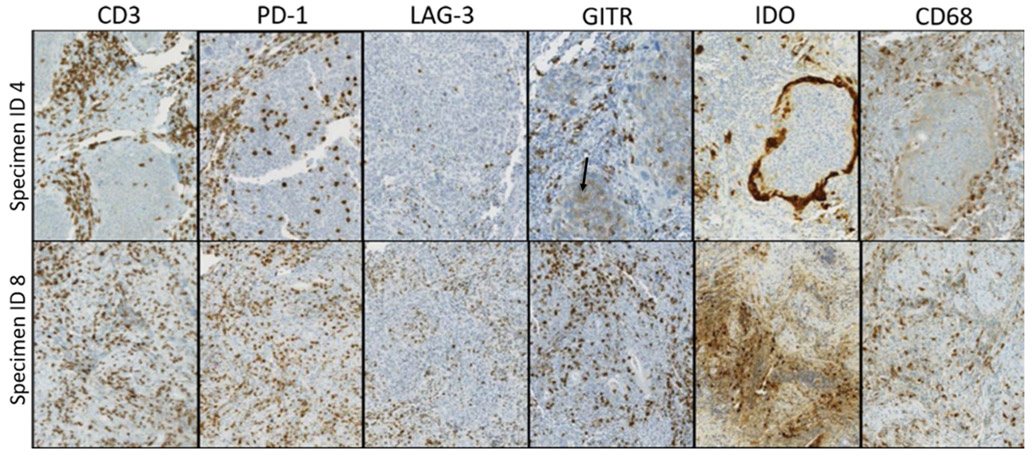
Fig. 2.
Patterns and prevalence of immune cell infiltrates and coregulatory molecule expression vary by HNSCC specimen. Individual tumor specimens showed varied expression of different markers. For example, both specimens #4 and #8 (top and bottom rows, respectively) are CD3+ T cell inflamed tumors with prominent PD-1 expression. However, specimen #8 also shows LAG-3+ and GITR+ immune cell populations proportionate to PD-1 expression, while specimen #4 has notably less LAG-3 expression. Low-level GITR expression by tumor cells is also present in specimen #4 (black arrow). Additionally, IDO-1 staining patterns differed across specimens. For example, specimen #8 shows constitutive tumor cell IDO-1 expression, whereas specimen #4 shows prominent IDO-1 display at the tumor–host interface in an adaptive pattern

