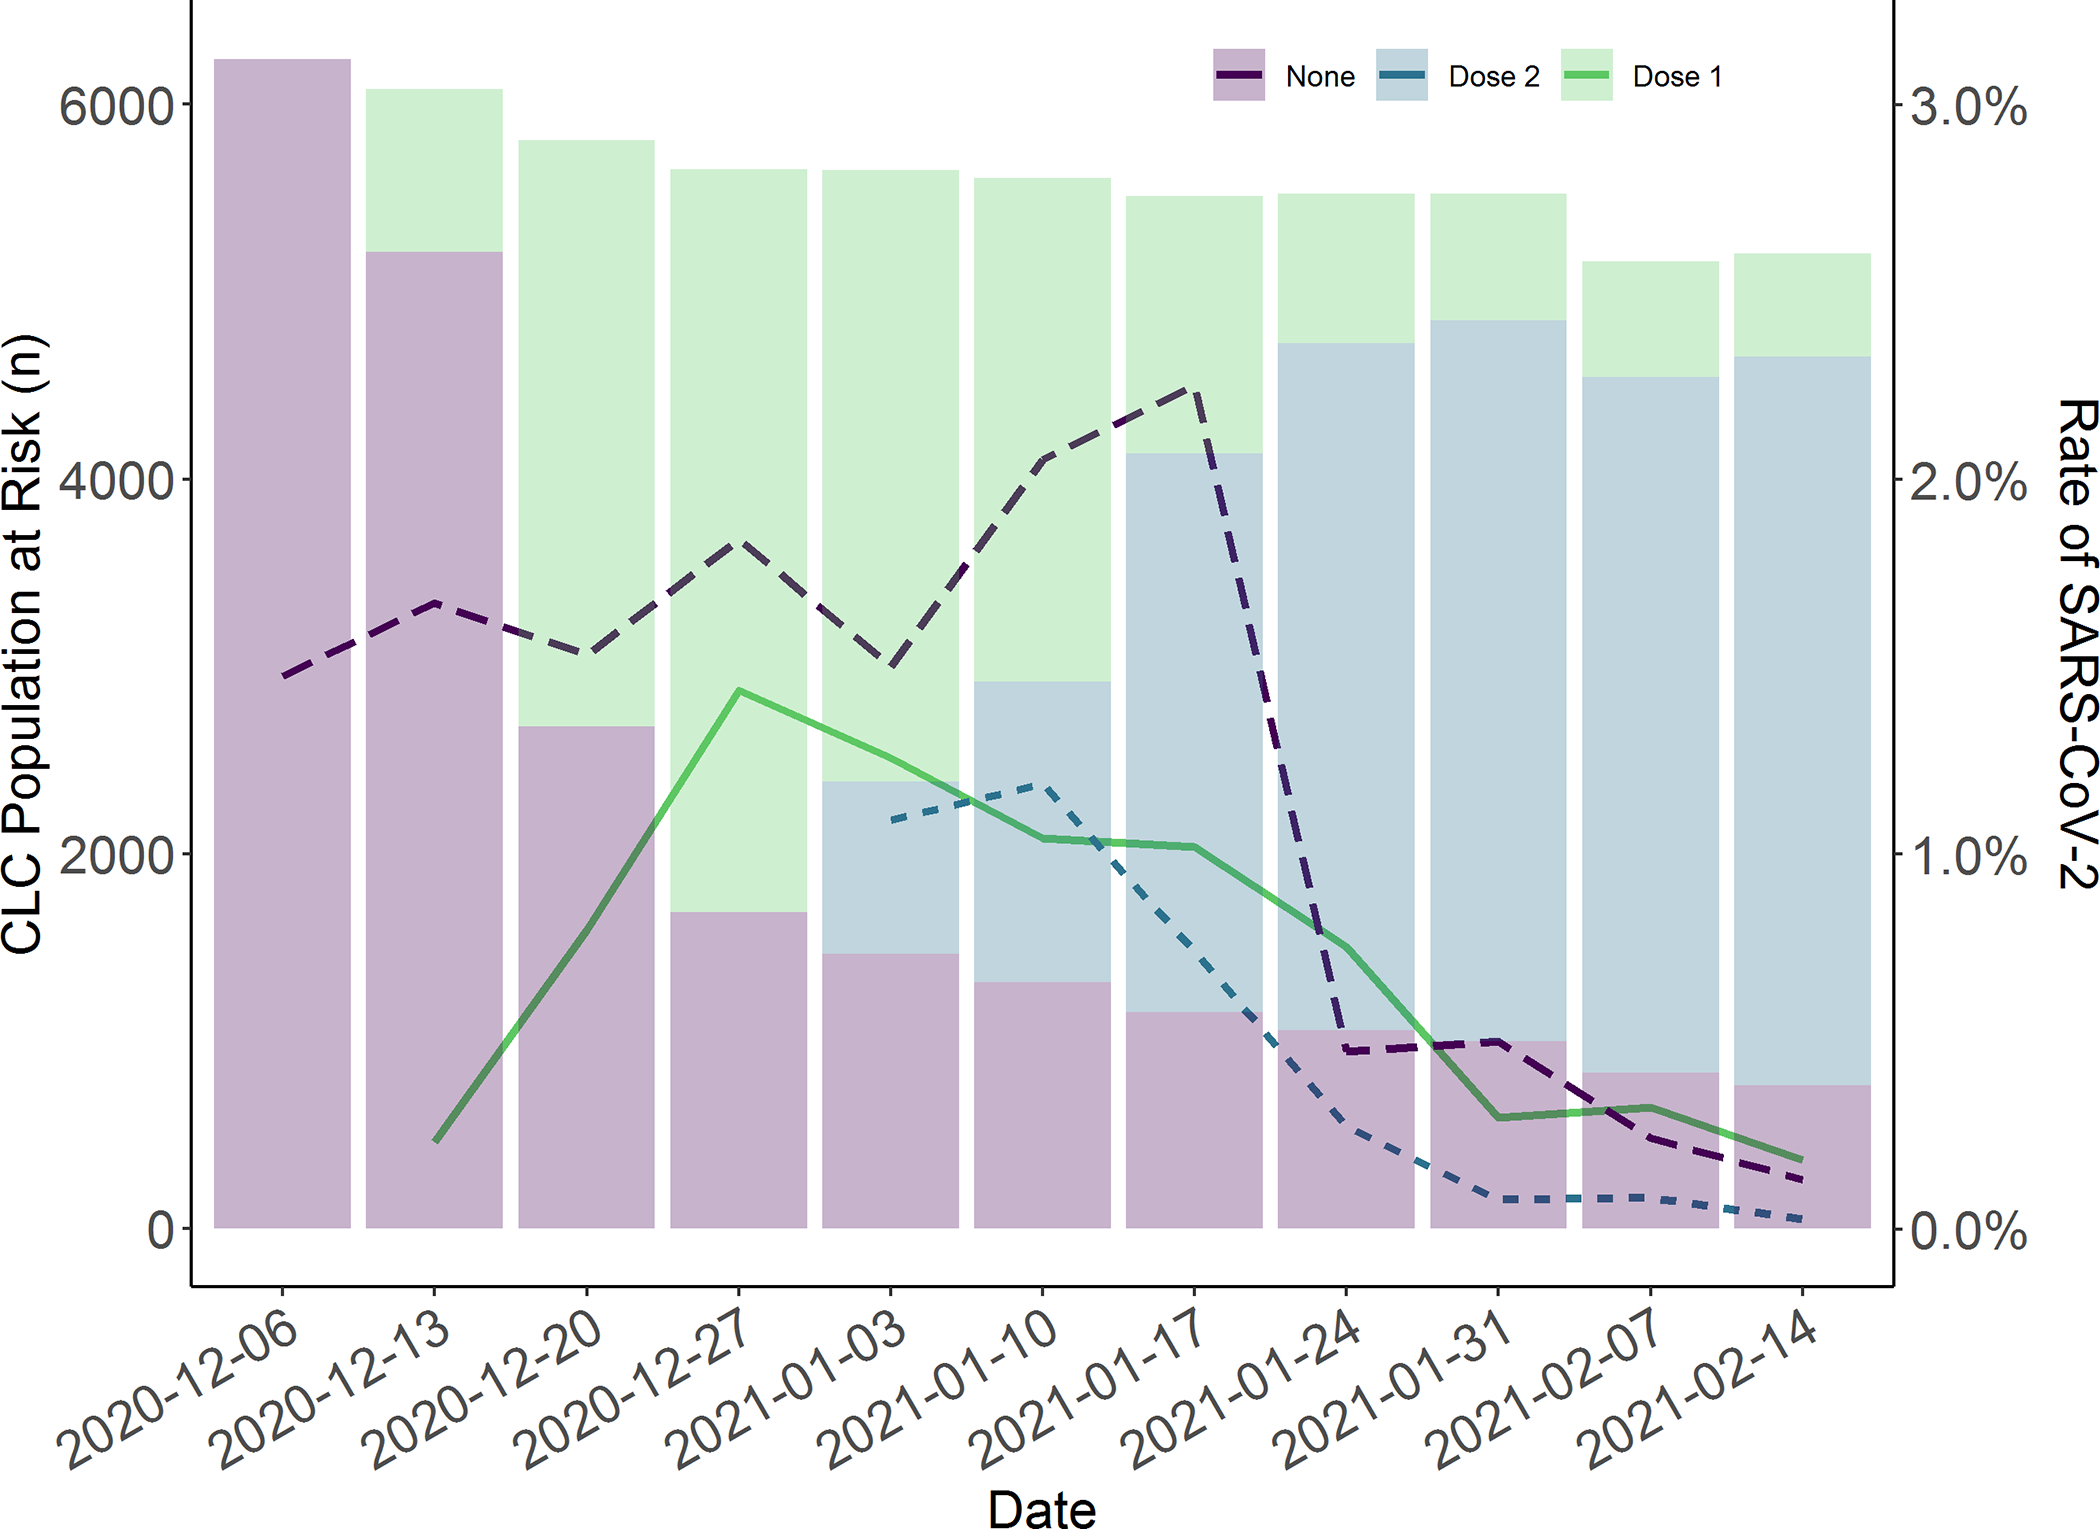
Figure 1:

SARS-CoV-2 Vaccination of Community Living Center (CLC) Residents. These results are pooled across 130 CLCs. The line represents the proportion of SARS-CoV-2 positive tests (left Y-axis) according to vaccination status. The bars represent the number of residents in the CLCs during the week according to vaccine status (right Y-axis). Vaccines were approved on December 11, 2020 and December 18, 2020 (week 3 of 2021). The proportion of SARS-CoV-2 positive tests declined in the unvaccinated group as well as the vaccinated groups.
