
Figure 2. Nuclear FGFR1 occupies chromatin at transcription start sites of genes associated with antiestrogen resistance.
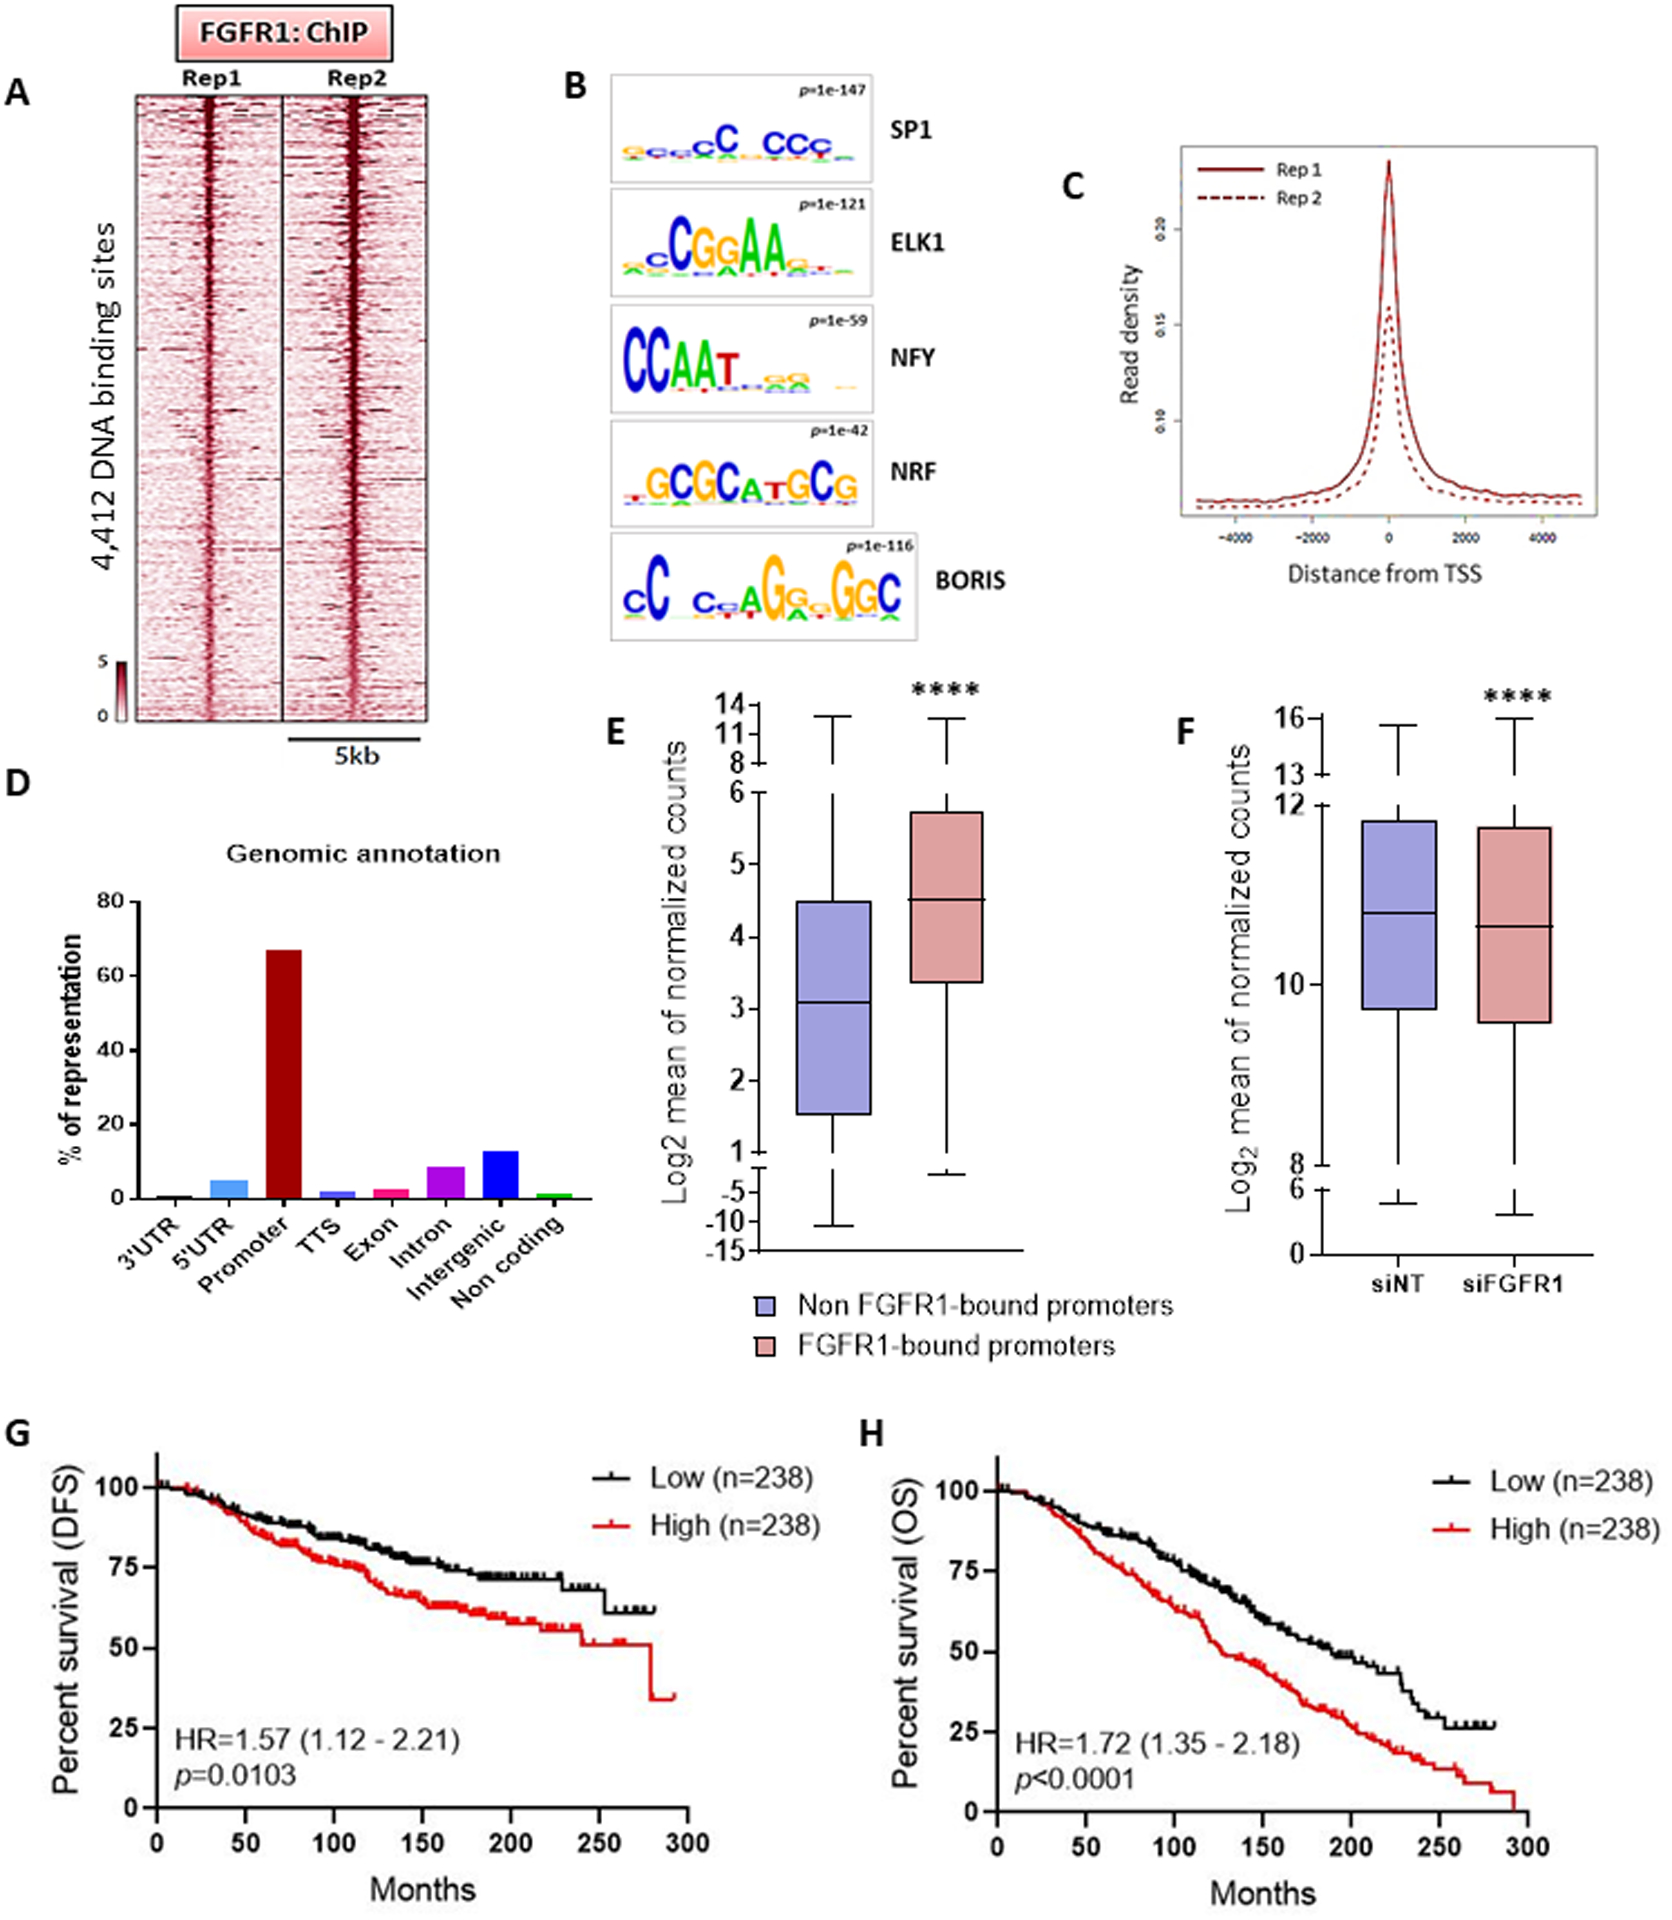
(A) Heatmap showing ChIP-Seq read densities around the FGFR1 bound regions in CAMA1 cells, in two replicates. The x-axis represents read densities within 5-kb region around the peak summit; the y-axis represents each predicted binding site. Cells were cultured for 48 h in IMEM/10% CSS. (B) Top consensus motifs, identified by de novo motif analysis, at genomic loci bound by FGFR1 identified in A. Statistical significance expressed as p value for each motif is shown. (C) Plot representing the density of the FGFR1 distribution around the Transcription Start Sites (TSS) in the two ChIP-Seq replicates. (D) Genomic annotations for the FGFR1 binding sites identified by ChIP-Seq showing enrichment of promoter regions. (E) Expression level of genes whose promoter is bound by FGFR1 (red) (2704 genes) versus gene expression of all other genes (blue) (10,452 genes). Data are derived from RNA-Seq on CAMA1 cells cultured for 48 h in IMEM/10% CSS (**** p<0.0001, Mann-Whitney test). (F) Gene expression of genes whose promoter is bound by FGFR1 in CAMA1 cells upon siRNA-mediated FGFR1 knockdown (n=3) (**** p<0.0001, Two-tailed Wilcoxon test). (G) Disease Free Survival (DFS) and Overall Survival (H) of the METABRIC cohort of 950 ER+/HER2- breast cancer patients treated with antiestrogens as a function of the FGFR1-associated polygenic score (Lowest Quartile vs Highest Quartile). The signature score was calculated by GSVA (77).