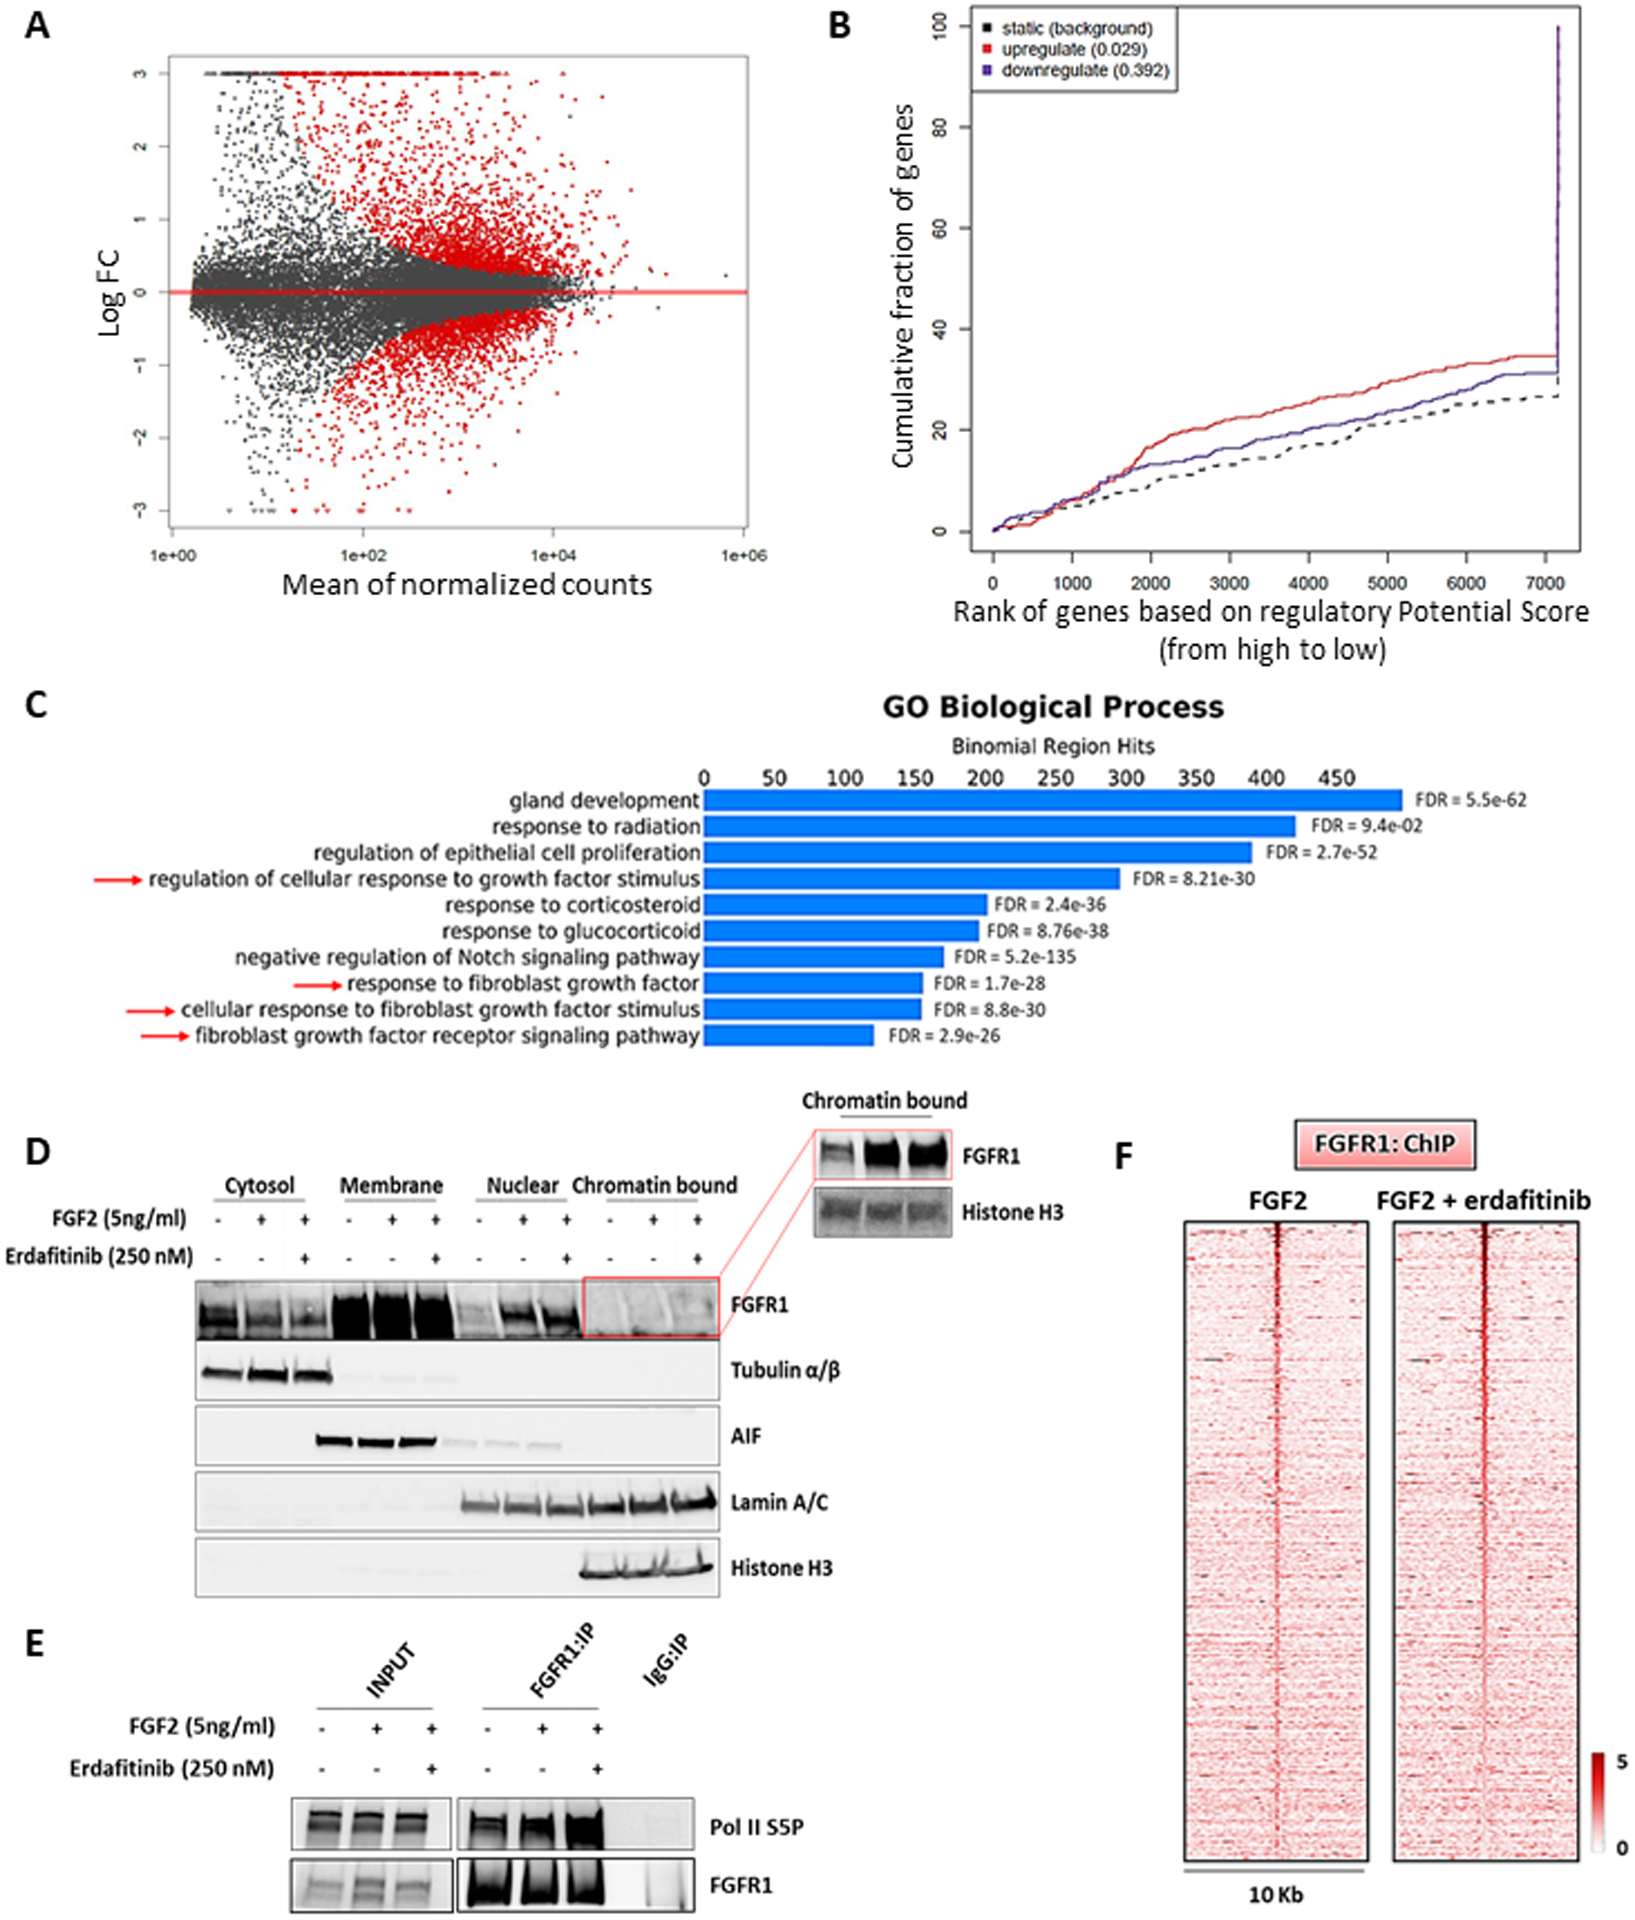
Figure 6. Nuclear FGFR1 activity is enhanced by FGF2 but not affected by receptor tyrosine kinase blockade.

(A) MA plot of M (log ratio) versus A (log mean average) normalized counts, showing differentially expressed genes with p <1e-5 in response to FGF2 (5 ng/ml, 6 h). (B) Prediction of activating or repressing transcription function of FG2-stimulated FGFR1 by BETA platform. FGFR1 ChIP-Seq results from CAMA1 cells stimulated with FGF2 (5 ng/ml, 3 h) and RNA-Seq data from A were integrated. Genomic regions bound by FGFR1 are predicted to modulate expression of genes upregulated upon FGF2 stimulation, but not downregulated genes; p values indicate the significance of the associations compared to background non-regulated genes. (C) GREAT analysis the FGFR1 DNA binding sites identified by FGFR1 ChIP-Seq in CAMA1 cells stimulated with FGF2 (5 ng/ml, 3 h). Top ten enriched Gene Ontology (GO) Biological Processes and binomial FDR values are shown. (D) Subcellular fractionation on CAMA1 cells, showing FGFR1 in cytosolic, membrane, soluble nuclear and chromatin bound compartments, after treatment with FGF2 (5 ng/ml, 3h) ± erdafitinib (250 nM, 3h). Red box shows longer exposure. (E) Co-precipitation of FGFR1 and Pol II S5P from sonicated and nuclease-treated lysates of CAMA1 cells ± FGF2 (5 ng/ml, 3h) ± erdafitinib (250 nM, 3h). (F) Heatmaps of ChIP-Seq read densities around the FGFR1-bound regions in CAMA1 cells treated with FGF2 (5 ng/ml, 3h) ± erdafitinib (250 nM, 3h).
