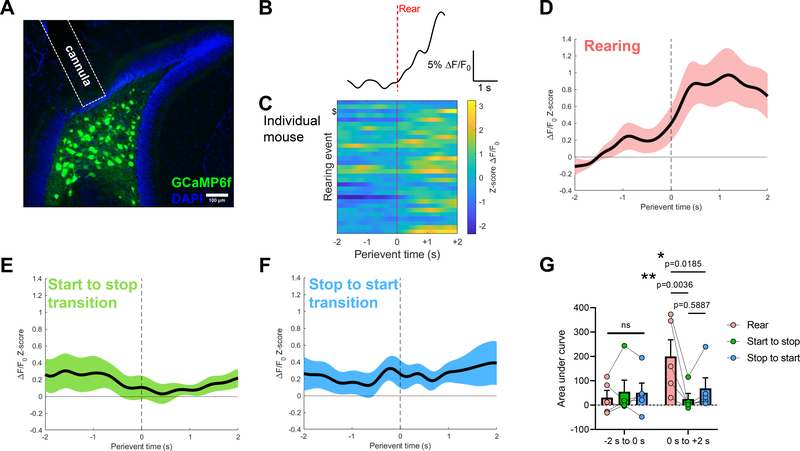
Figure 2. In vivo fiber photometry reveals vMCs are selectively activated by exploratory rearing.
A Fluorescence microscopy of GCaMP6f expression in vMCs by intersectional targeting and fiber optic cannula placement. B Example individual photometry trace surrounding an exploratory rearing event. Vertical red dashed line corresponds to initial rearing apogee. C ΔF/F0 Z-scores of rearing events aligned to time of initial rearing apogee in an individual mouse. Events are ordered chronologically during the recording. $ corresponds to trace in (B). D ΔF/F0 Z-scores were aligned to time of rearing apogee (perievent time = 0), averaged within mouse, then averaged across mice (68 rearing events from N = 5 mice). Black line depicts mean ΔF/F0 Z-score, pink depicts SEM. E, F To test whether vMCs were activated by abrupt changes in motor behavior or non-rearing exploration, ΔF/F0 Z-scores for the same N = 5 mice from (D) during the same behavioral session were aligned to time when mice transitioned between XY-plane horizontal movement and no horizontal movement (E, “Start to stop”, 98 transitions), or between no horizontal movement and XY-plane horizontal movement (F, “Stop to start”, 98 transitions). Black line depicts mean ΔF/F0 Z-score, shading depicts SEM. G From the averaged ΔF/F0 Z-score curves, area under the curve was calculated for the 2 seconds before (−2 s to 0 s) and after (0 s to +2 s) the indicated behavioral event, revealing that vMC calcium activity during rearing was greater than both horizontal motor transitions in the time period immediately following the behavior but not leading up to the behavior (time × behavior interaction: F(2, 8) = 8.498, p = 0.011; time: F(1, 4) = 19.24, p = 0.012; behavior: F(2, 8) = 4.197, p = 0.057). Pairwise comparison p values are shown on figure.

