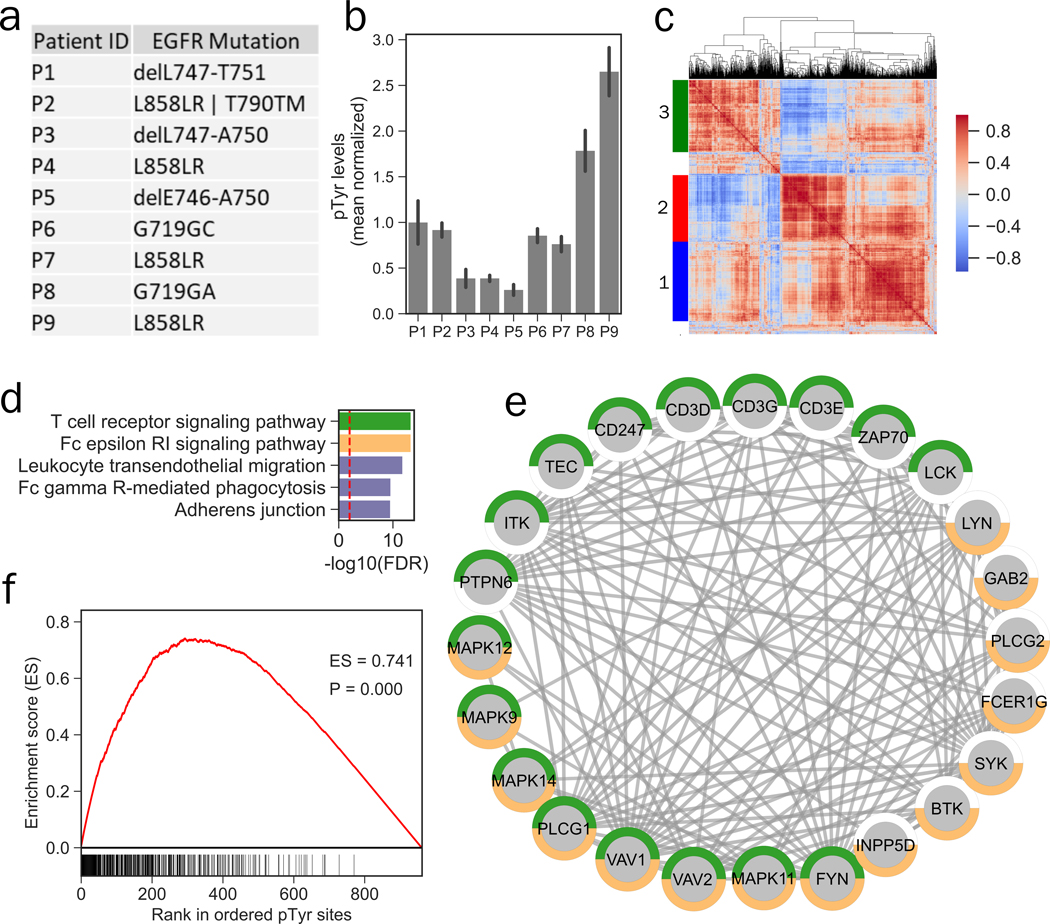
Figure 2.
Phosphotyrosine analysis of archived FFPE tissues from NSCLC patients. a) Mutation status of EGFR in various patients. b) Phosphotyrosine levels of EGFR averaged across multiple tyrosine sites (Y1068, Y1148 and Y1173) plotted relative to the mean of all 9 tumors. Error bars represent standard deviation. c) Hierarchical clustering heatmap of co-correlation matrix for pTyr sites quantified in NSCLC FFPE specimens. Clustering was based on Euclidean distance. Color-scale represents Pearson’s correlation. Three main clusters were identified in this analysis. d) Top 5 significantly enriched Kegg pathways in pTyr-proteins belonging to cluster 1. Dashed red line depicts FDR q-value = 0.01. e) Interaction network of proteins belonging to T cell receptor (green) and Fc epsilon RI (orange) signaling pathways that were identified in cluster 1. All of the interactions are highest confidence based on all interaction sources except text mining from STRING database. f) Cluster set enrichment analysis for cluster 1 pTyr sites in Patient 9 (P9).

