Figure 3.
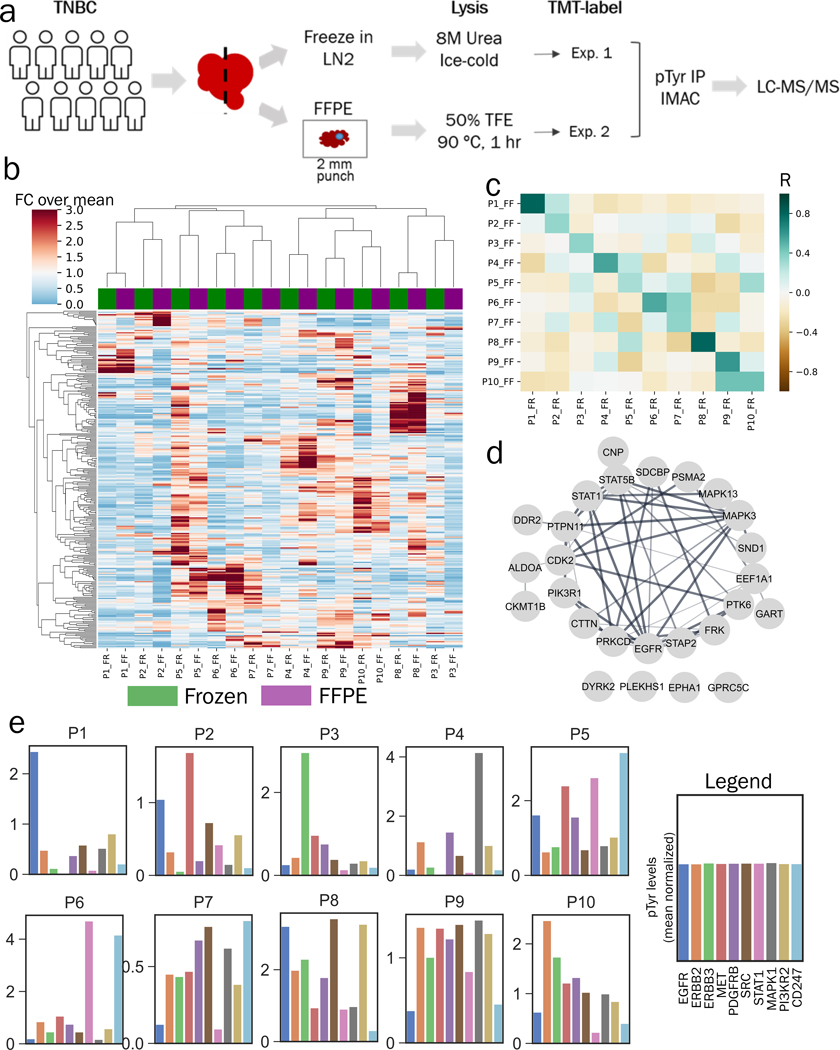
Phosphotyrosine analysis of breast cancer clinical specimens. a) Experimental workflow to compare pTyr signaling in FFPE and flash frozen specimens from breast cancer patient tumors. b) Hierarchical clustering heatmap based on Pearson correlation distance metric of pTyr peptides identified and quantified in FFPE and flash frozen conditions. Quantification levels were mean normalized within each workflow before concatenating together. Total of 281 pTyr peptides were quantified in both workflows. c) Heatmap of Pearson correlation (R) between flash frozen and FFPE tissues for each patient. Average R for FFPE and frozen pairs (from same patient) was 0.51 ± 0.18 and 0.05 ± 0.16 for all other pairwise analyses. d) Interaction network of pTyr-proteins that were highly preserved in FFPE tissues. Phosphotyrosine sites belonging to these proteins had highest Pearson correlation for quantified levels in flash frozen and FFPE specimens. e) Barplots with phosphorylation levels of various proteins quantified for each patient based on FFPE tissues. Phosphorylation levels represent average phosphorylation across multiple pTyr sites for a given protein target and are plotted relative to the mean of all 10 tumors (mean normalized).

