Figure 4.
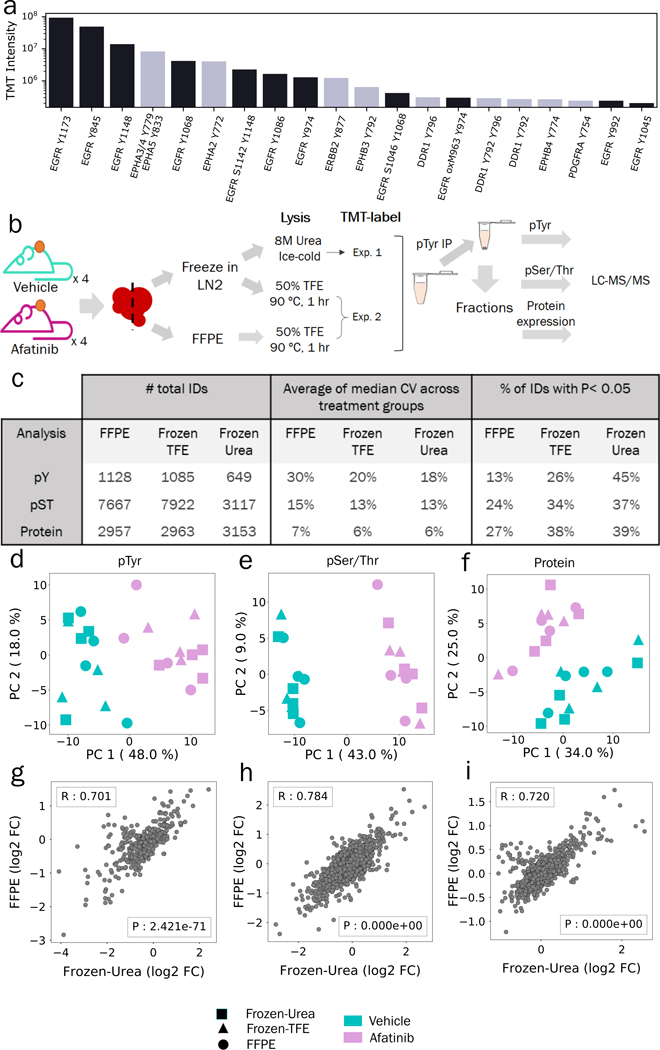
Comparison of pTyr, pSer/Thr and proteins levels in FFPE and flash frozen tissues after treatment with Afatinib. a) TMT intensities of 20 most abundant phosphopeptides belonging to RTKs from FFPE GBM6 PDX tumor from Figure 1e. TMT values were summed across all channels and plotted for each phosphopeptide. b) Schematic of experimental design to compare proteomics in FFPE and flash frozen tissues. c) Number of unique phospho-peptides or proteins identified and quantified across different workflows with observed CVs and proportion of significantly different IDs between vehicle and afatinib treatments (n = 4 biological replicates). d-f) Principal component analysis of phospho-peptides or proteins quantified across FFPE, Frozen-Urea and Frozen-TFE workflows: (d) pTyr (n = 475 peptides), (e) pSer/Thr (n = 2283 peptides) and (f) protein level (n = 2647 proteins). Quantified levels were mean normalized and log2 transformed within each workflow before concatenating together. g-i) Correlation plots of fold changes observed between afatinib and vehicle treated groups in Frozen-Urea samples and their FFPE pairs: (g) pTyr, (h) pSer/Thr and (i) proteins. For each phospho-peptide or protein, fold changes were calculated between mean levels observed in afatinib (n = 4) and vehicle (n = 4) treated groups. R represent Pearson’s correlation.

