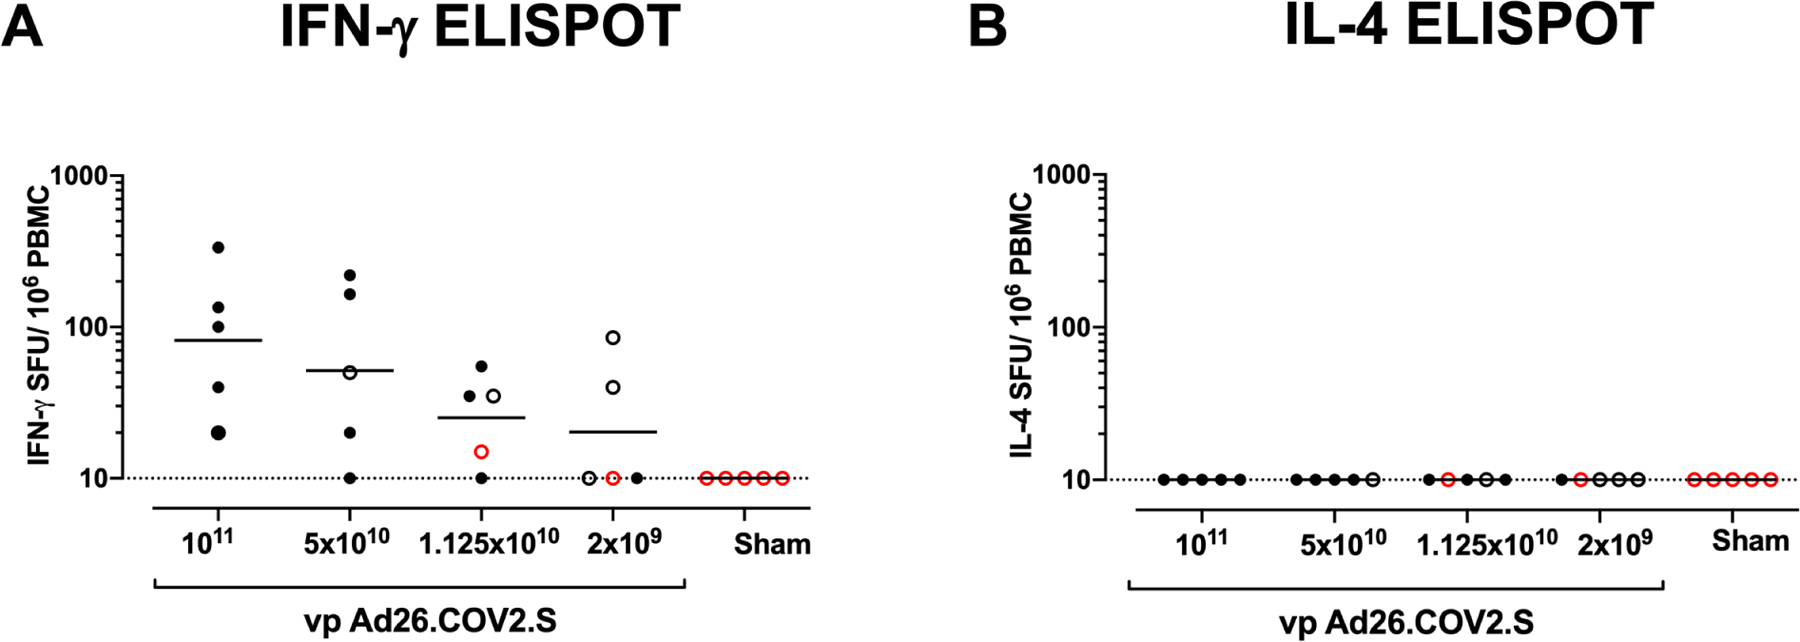
Figure 2. T cell responses in vaccinated rhesus macaques.

Cellular immune responses were assessed at week 4 following immunization by (A) IFN-γ and (B) IL-4 ELISPOT assays in response to pooled S peptides. Horizontal bars reflect geometric mean responses. Dotted lines reflect assay limit of quantitation. Solid black circles indicate animals that showed no virus in BAL and NS following challenge, open black circles indicate animals that showed virus in NS but not BAL following challenge, and open red circles indicate animals that show virus in both BAL and NS following challenge.
