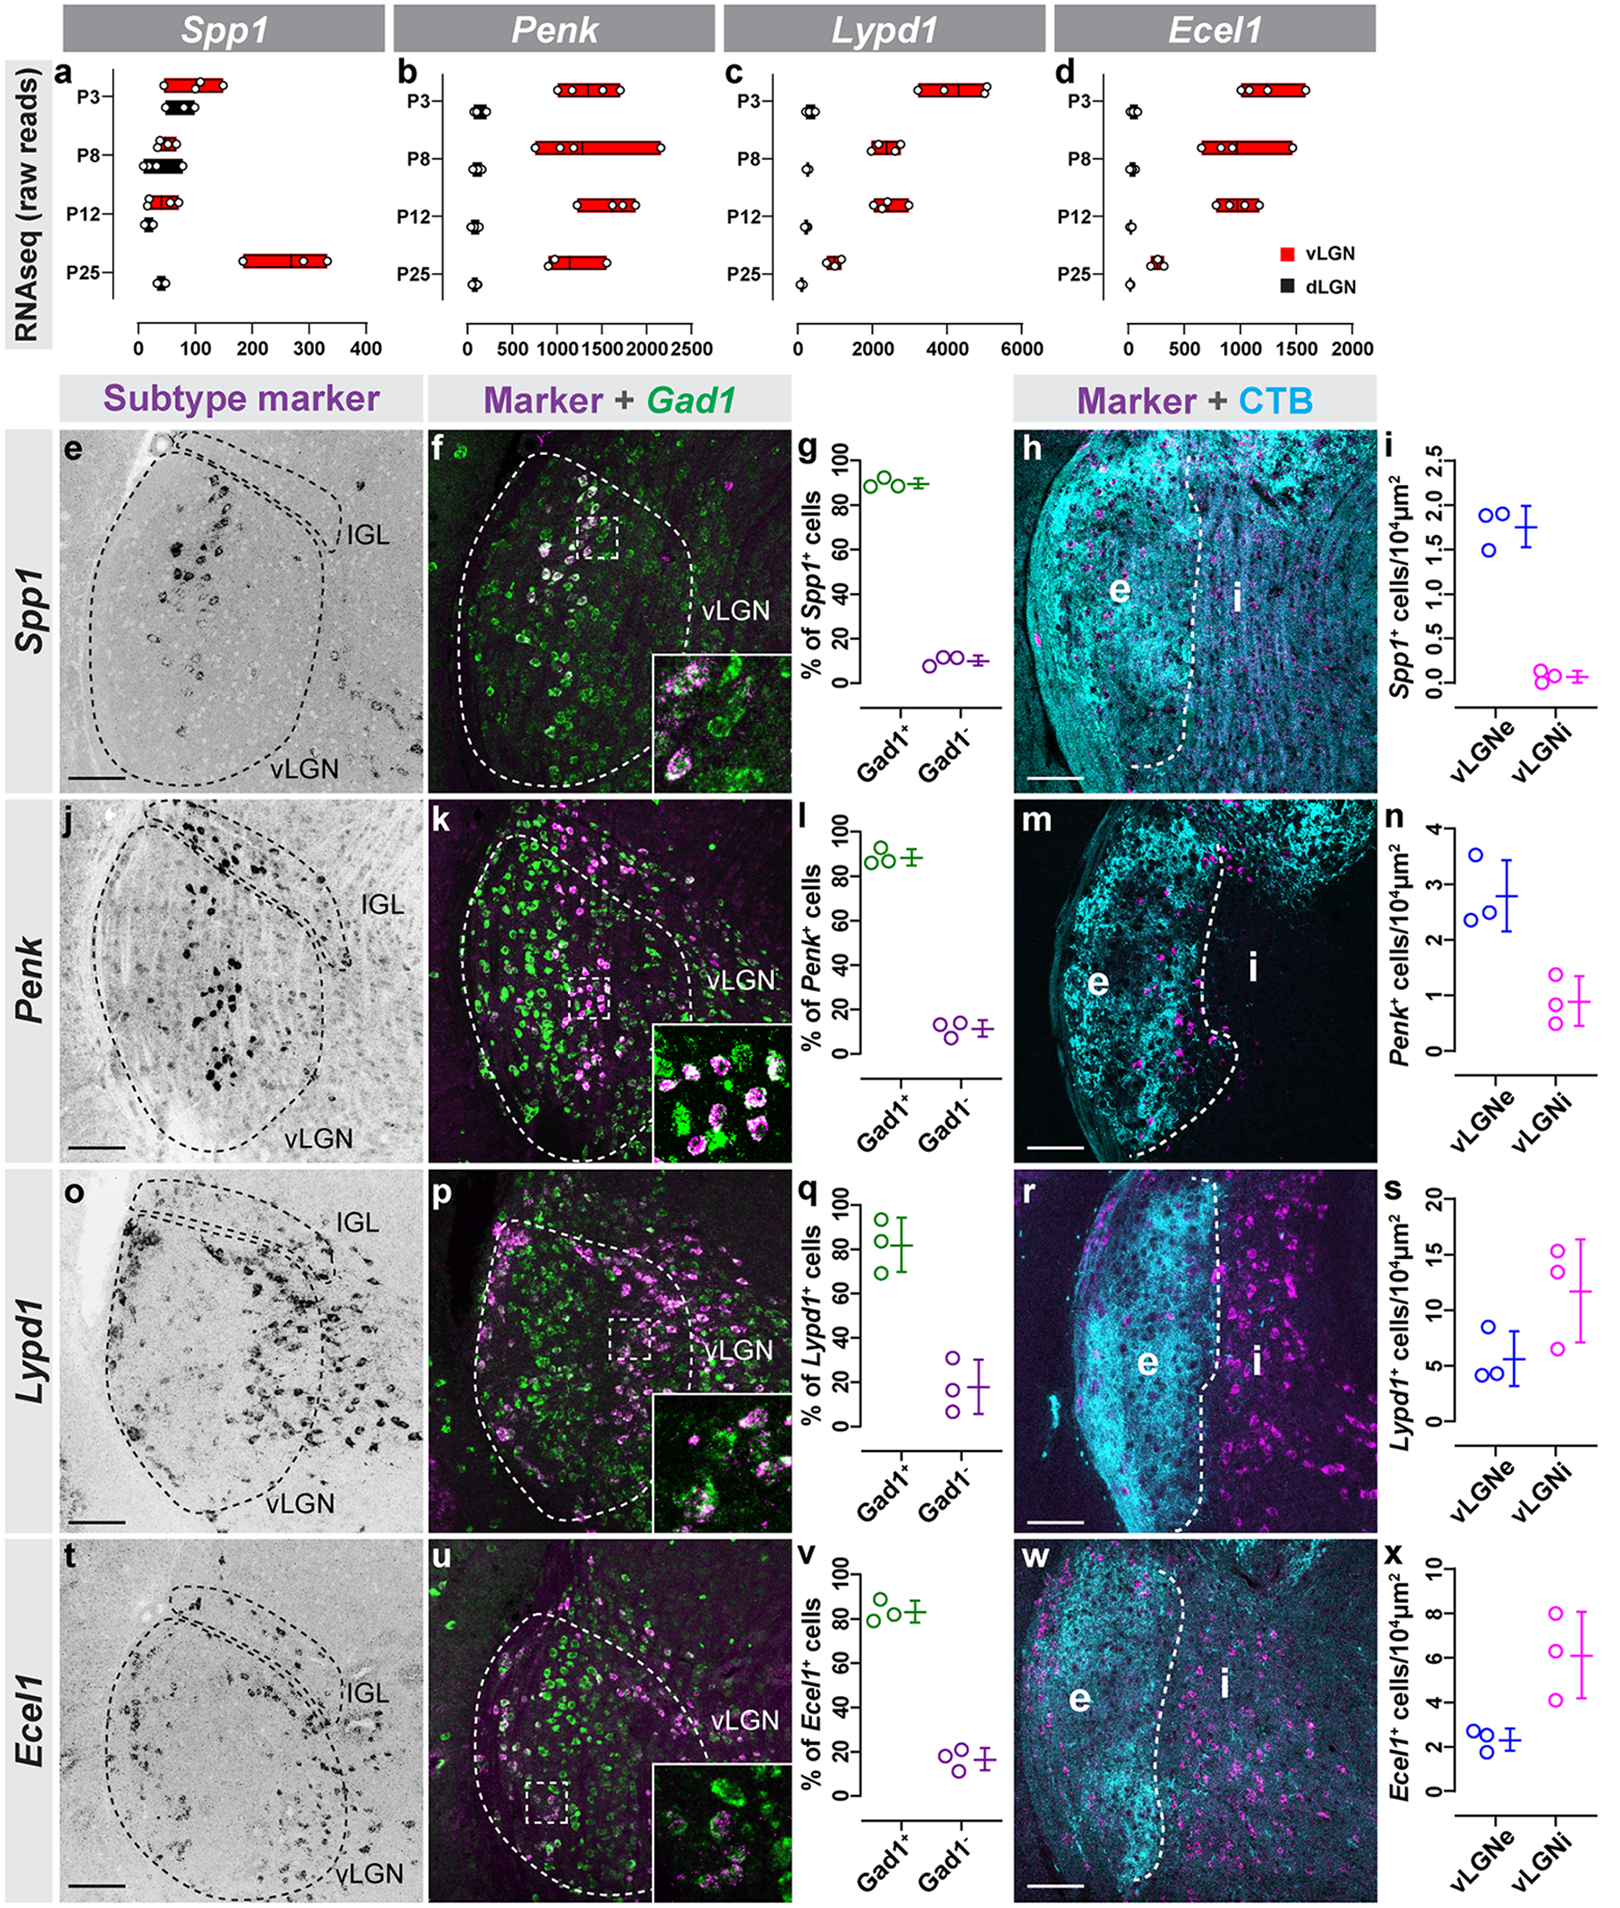
Figure 3. Novel genetic markers label subtypes of GABAergic neurons.

(a-d) Raw transcript reads Spp1 (a), Penk (b), Lypd1 (c), and Ecel1 (d) mRNA in vLGN and dLGN obtained by RNAseq. Individual datapoints plotted as white circles, min/max values are confined to the red bars, and vertical black line with bars depicts mean. (e) ISH for Spp1 mRNA in P60 vLGN. (f) Double ISH for Spp1 and Gad1 mRNA in vLGN. (g) Quantification of the percentage of Spp1+ cells that co-express Gad1 mRNA. Data points represent biological replicates, bars represent mean ± SD. (h) ISH-labeling Spp1+ neurons in vLGNe and vLGNi following intravitreal CTB injection. (i) Quantification of the density of Spp1+ neurons in vLGNe and vLGNi. Data plotted as in (g). (j) ISH for Penk mRNA in P60 vLGN. (k) Double ISH for Penk and Gad1 mRNA in vLGN. (l) Quantification of the percentage of Penk+ cells that co-express Gad1 mRNA. Data plotted as in (g). (m) ISH-labeling Penk+ neurons in vLGNe and vLGNi following intravitreal CTB injection. (n) Quantification of the density of Penk+ neurons in vLGNe and vLGNi. Data plotted as in (g). (o) ISH for Lypd1 mRNA in P10 vLGN. (p) Double ISH for Lypd1 and Gad1 mRNA in vLGN. (q) Quantification of the percentage of Lypd1+ cells that co-express Gad1 mRNA. Data plotted as in (g). (r) ISH-labeling Lypd1+ neurons in vLGNe and vLGNi following intravitreal CTB injection. (s) Quantification of the density of Lypd1+ neurons in vLGNe and vLGNi. Data plotted as in (g). (t) ISH for Ecel1 mRNA in P60 vLGN. (u) Double ISH for Ecel1 and Gad1 mRNA in vLGN. (v) Quantification of the percentage of Ecel1+ cells that co-express Gad1 mRNA. Data plotted as in (g). (w) ISH-labeling Ecel1+ neurons in vLGNe and vLGNi following intravitreal CTB injection. (x) Quantification of the density of Ecel1+ neurons in vLGNe and vLGNi. Data plotted as in (g). n=3 animals in all data presented. All scale bars = 100 μm.
