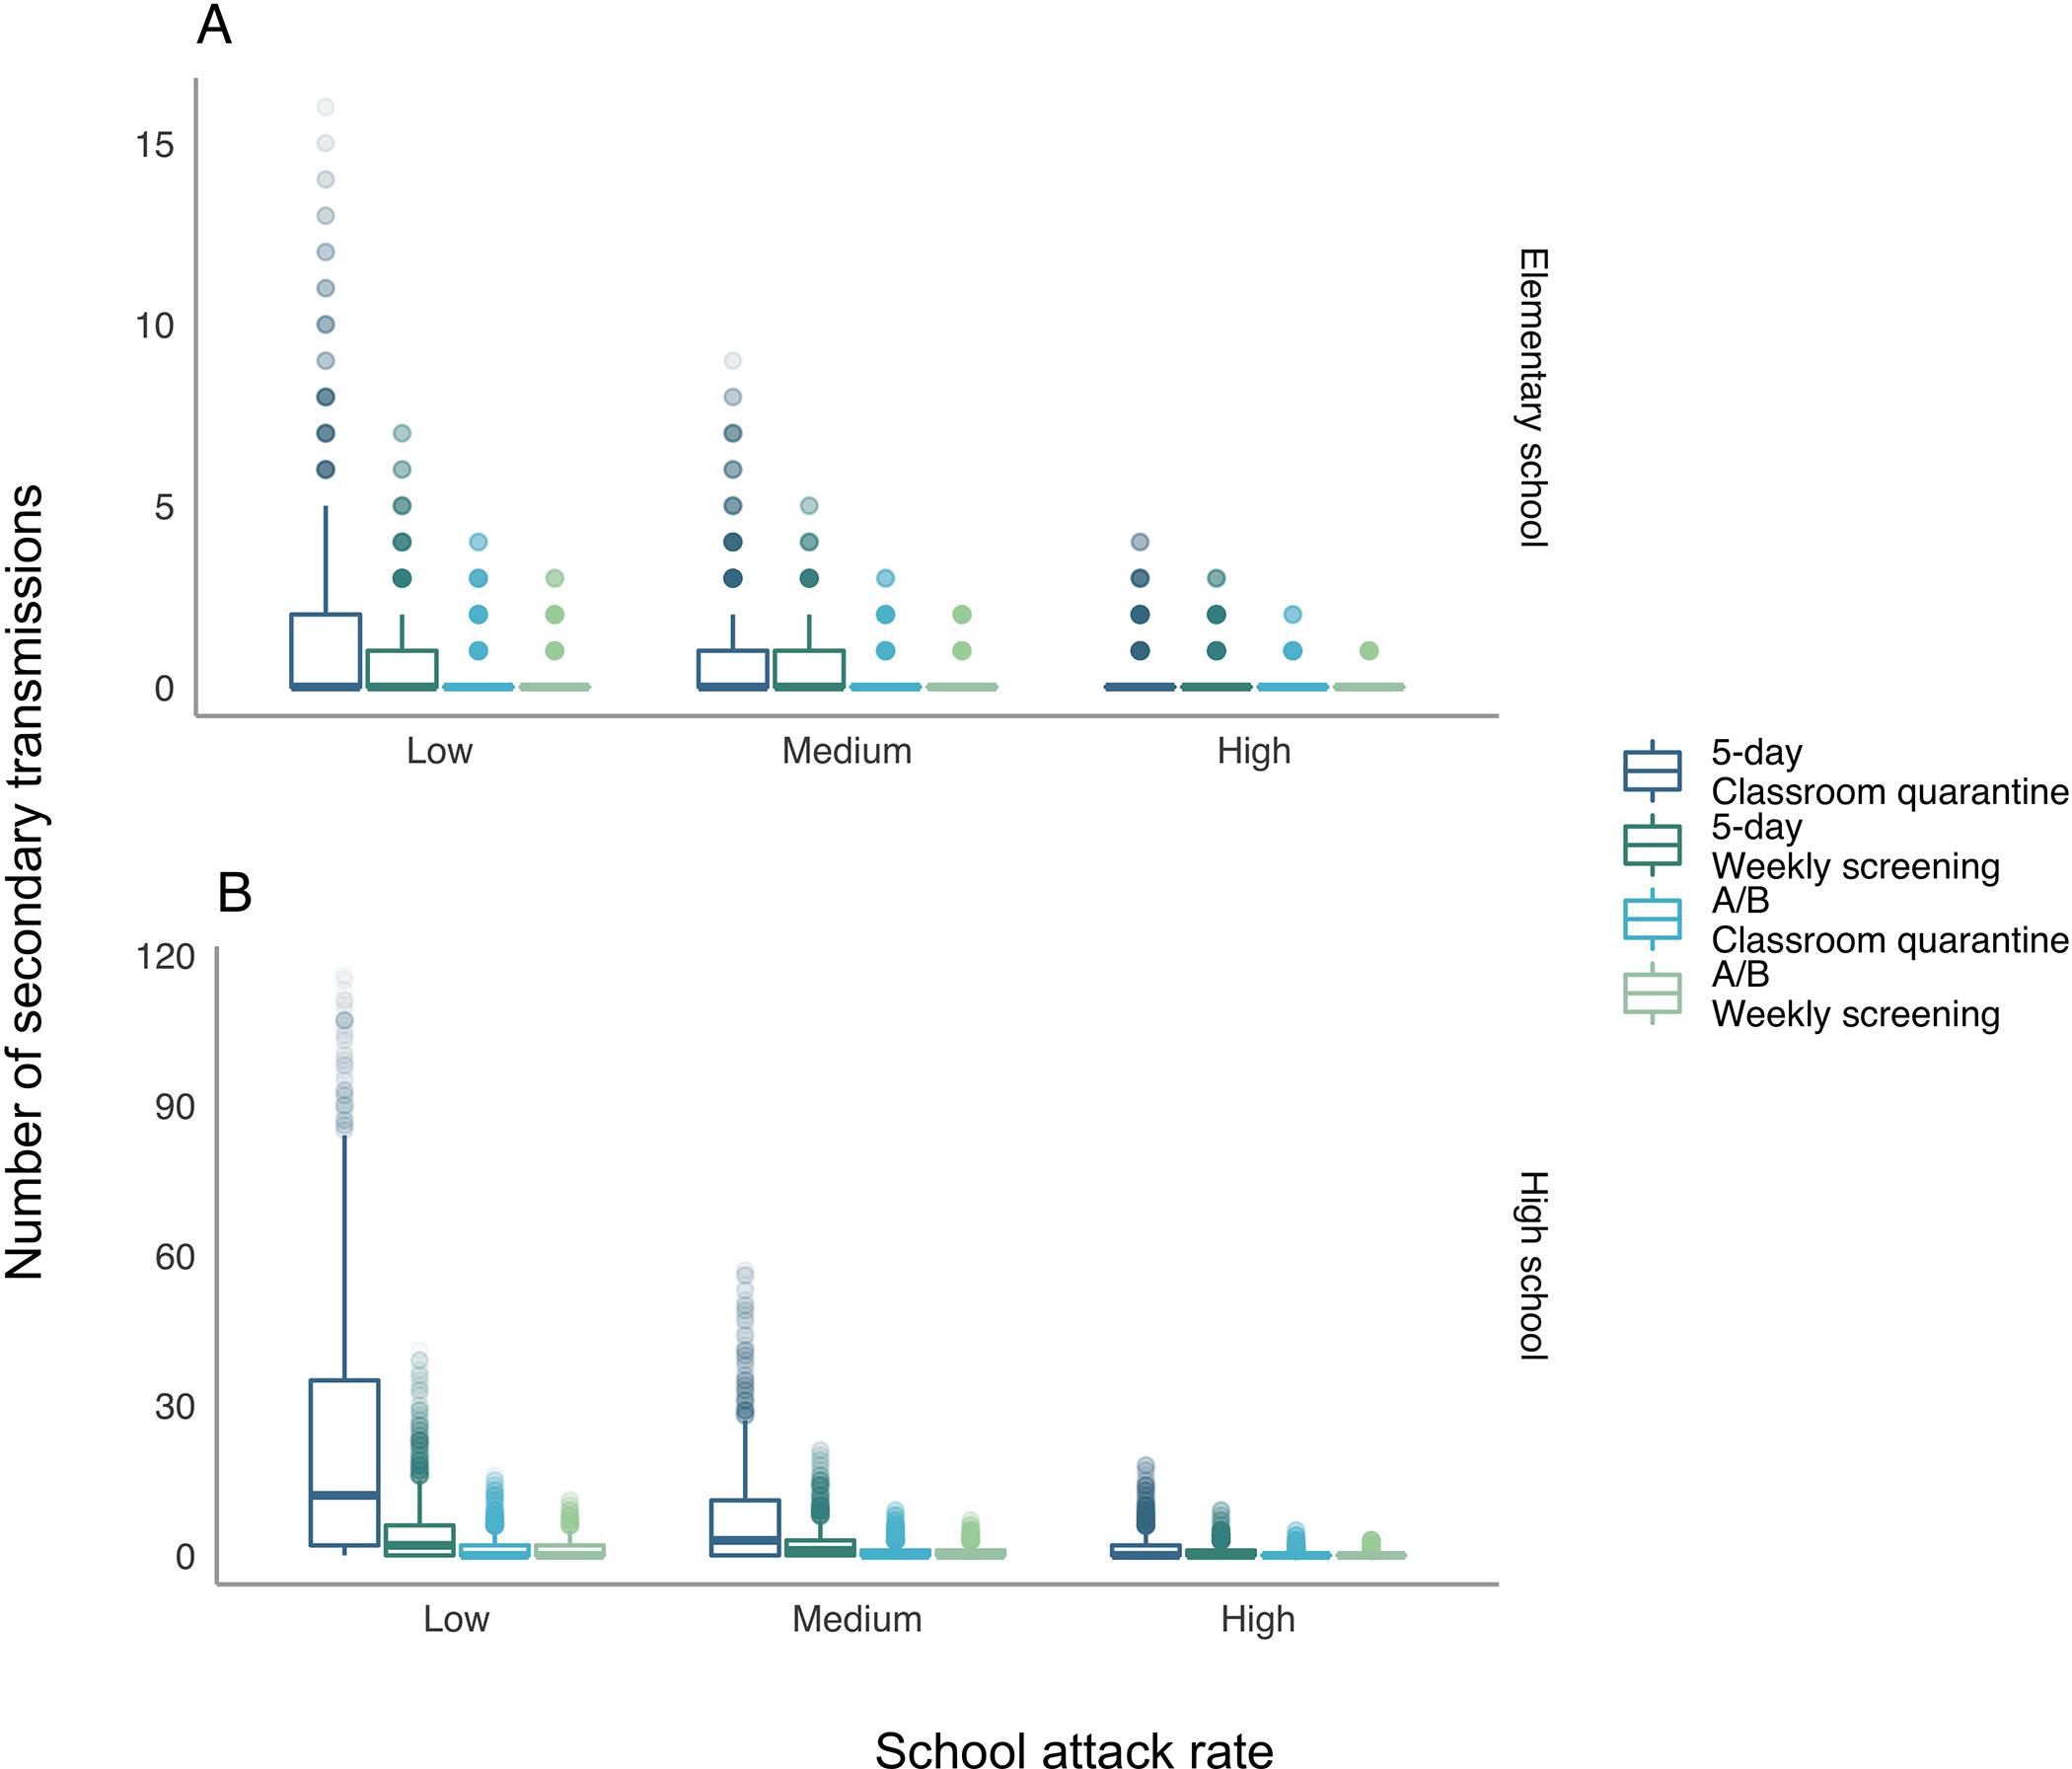
Figure 2. Distribution of secondary transmissions when a single case is introduced.

The figure displays the distribution of secondary transmissions (outside the index case patient’s household) when a single case is introduced into a school. The x-axis varies the level of in-school mitigation with “low” assuming minimal interventions and “high” assuming intensive interventions. Transmissions include both those directly from the index case and those from secondary and tertiary cases. Distributions are truncated at the 99.5th quantile (i.e., all outcomes occur with a probability ≥1/200). A/B = hybrid.
