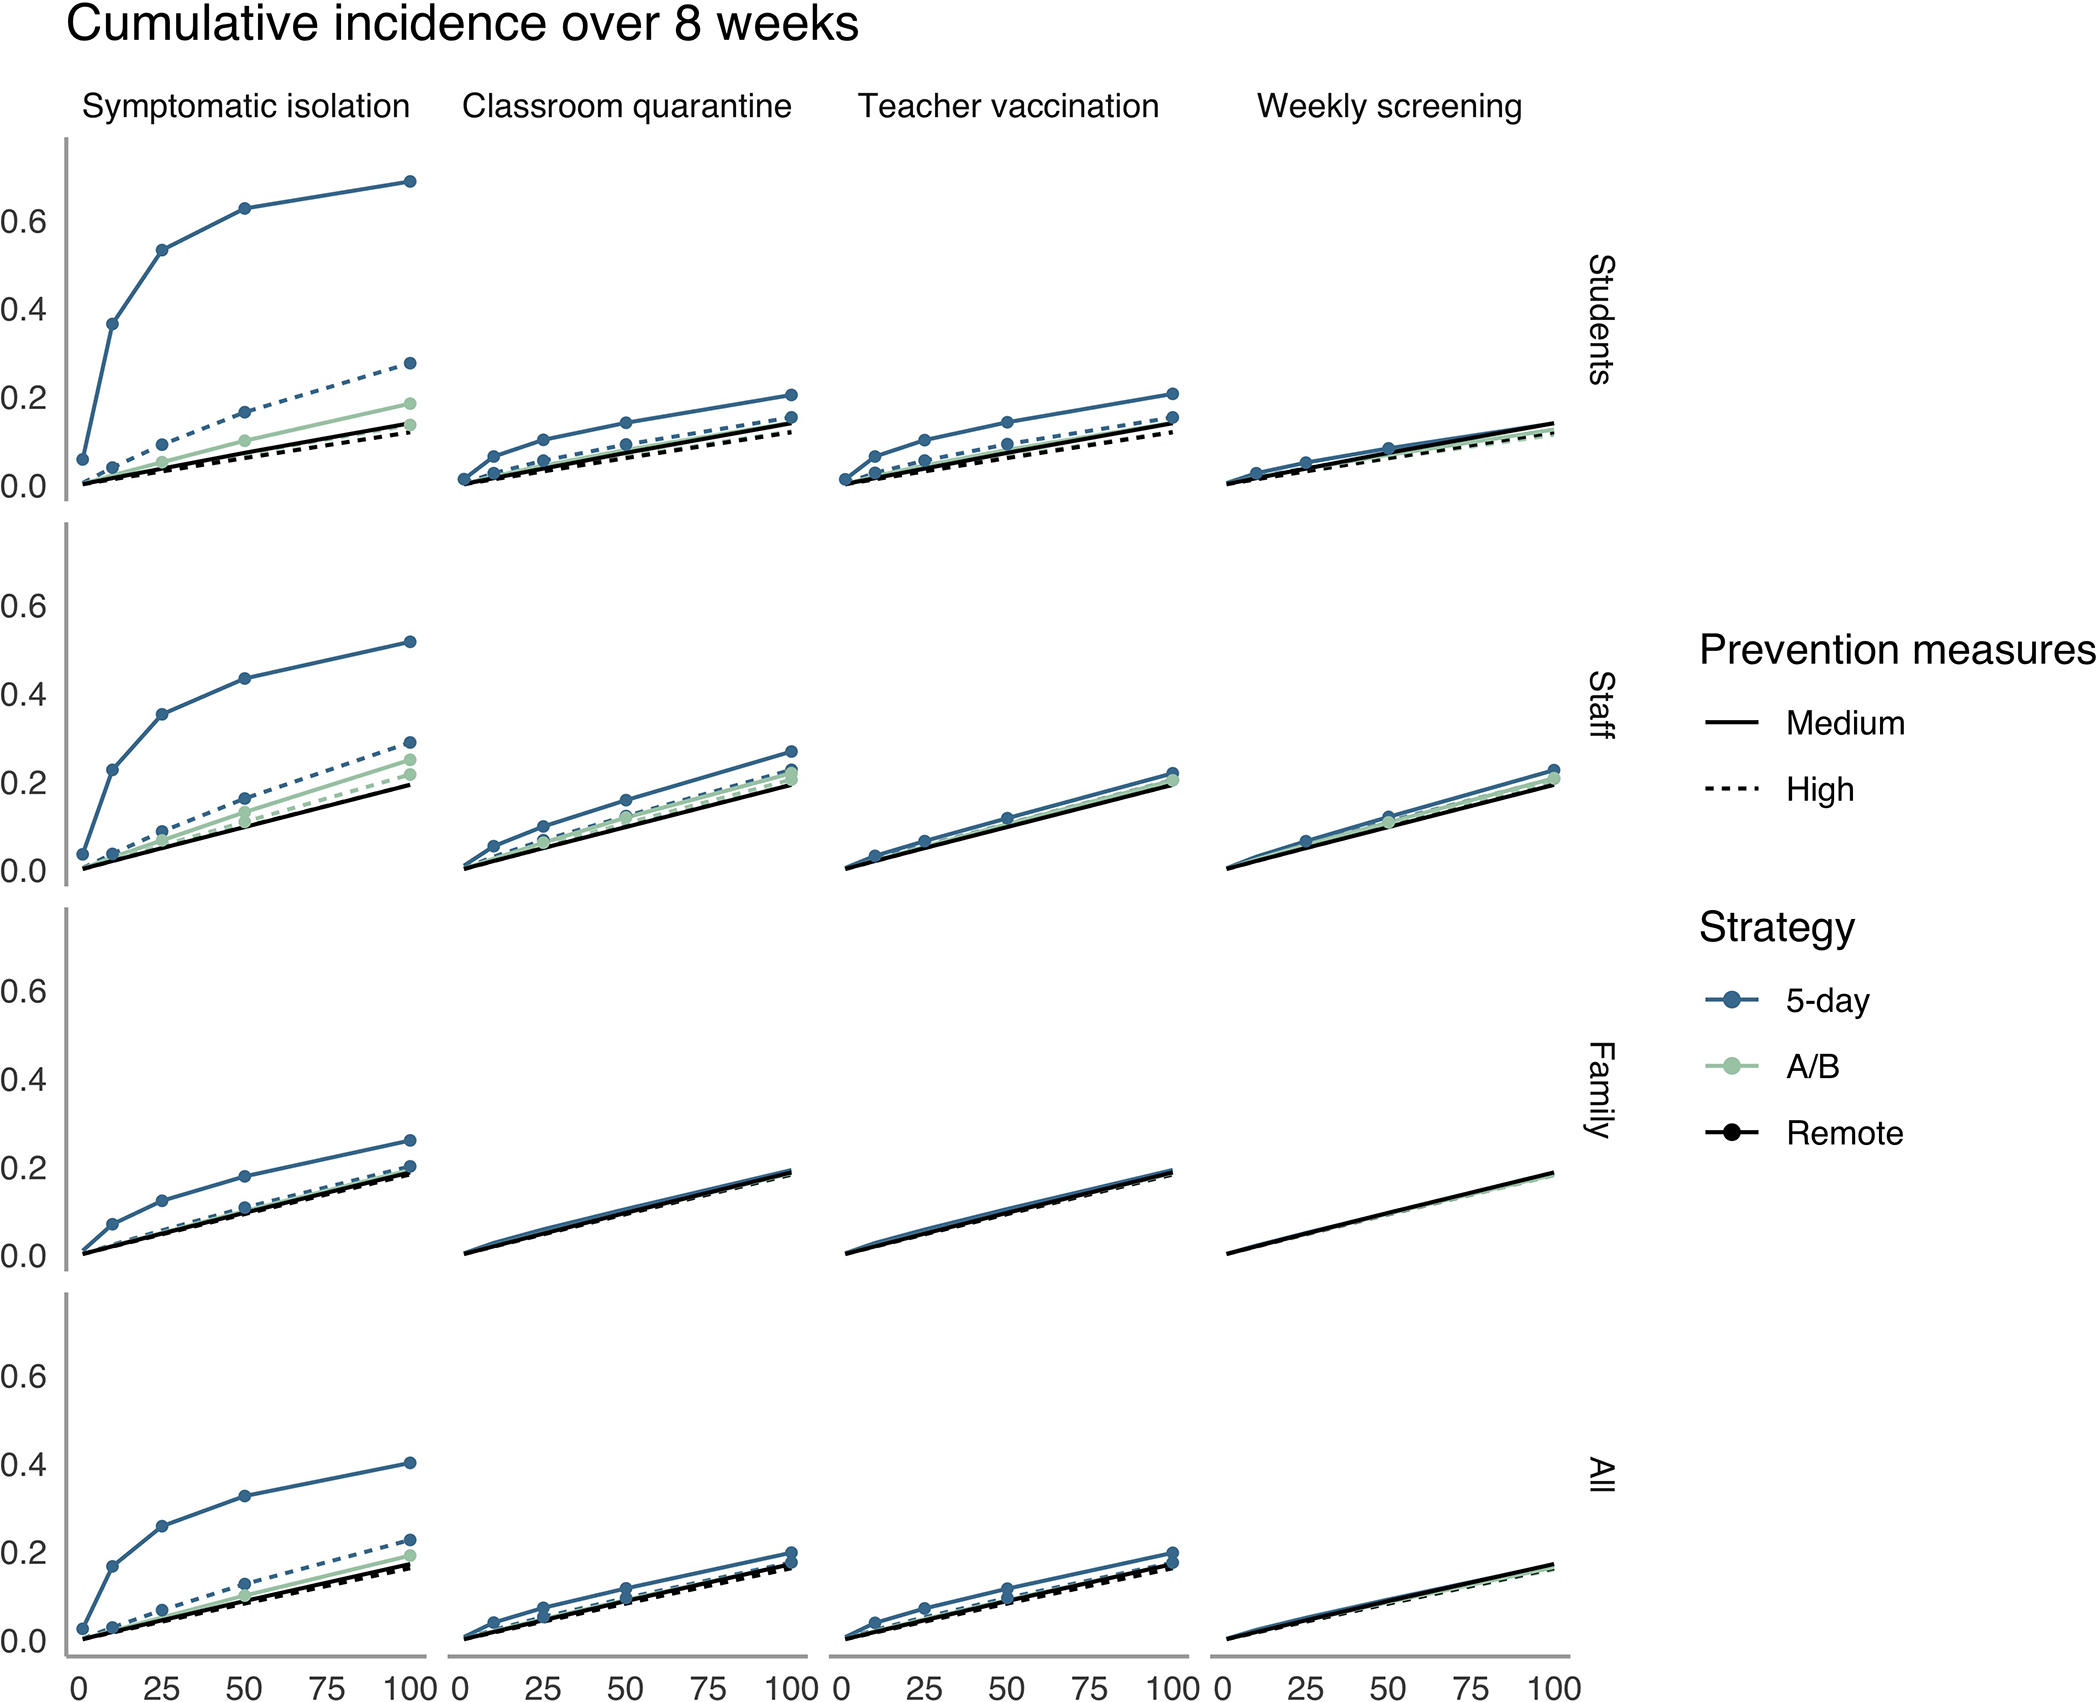
Figure 4. Cumulative incidence over 8 weeks in high schools.

The x-axis shows the average daily local incidence per 100 000 persons in the population. The y-axis shows cumulative incidence over 8 wk in the high school community. Columns denote isolation, quarantine, vaccination, and detection strategies, and rows show population subgroups. We mark a strategy with a point if it fails to meet the transmission control threshold for the subgroup (i.e., if there is a >1-point increase over remote learning in the percentage of the group infected during 8 wk). A/B = hybrid.
