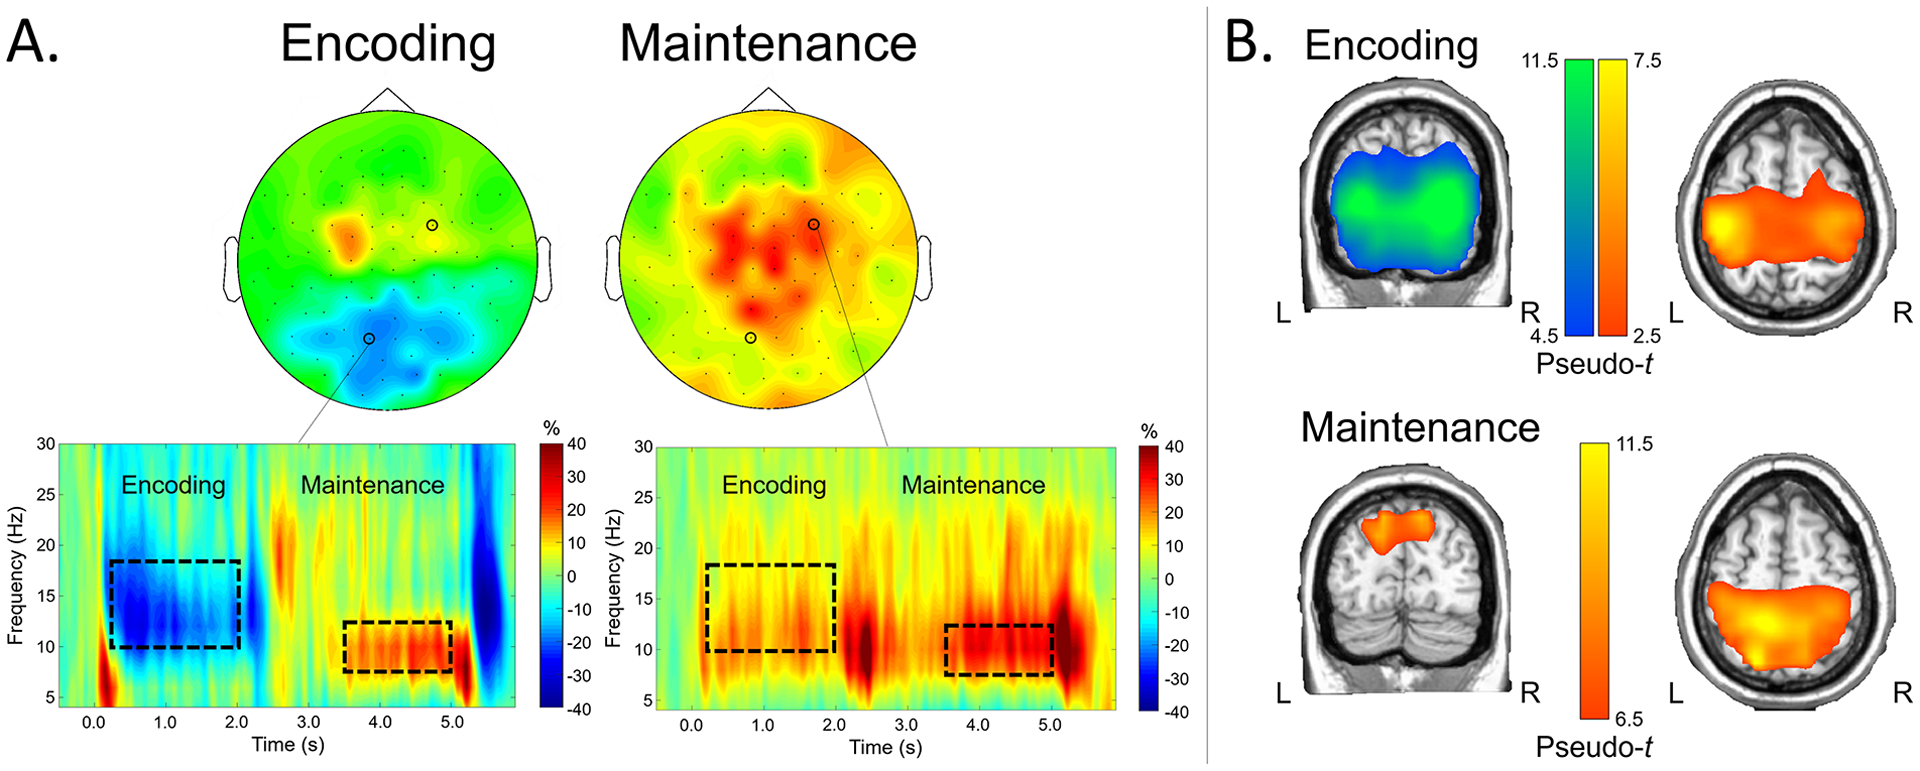
Figure 3.

A) Time-frequency components serving working memory in CHL. Time-frequency spectrograms from representative sensors are shown on the bottom, with frequency (in Hz) shown on the y-axis and time (in s; 0.0 s = encoding stimulus onset) shown on the x-axis. Color bars denote the percentage change from baseline, with warmer colors reflecting increases in power from baseline (i.e., ERS) and cooler colors reflecting decreases in neural power from baseline (i.e., ERD). Dotted boxes denote time-frequency components that were selected for source imaging; the distribution of activity across sensors within these time-frequency windows is shown on top (left: encoding; right: maintenance). B) Neural dynamics serving encoding and maintenance phases. Grand-averaged beamformer images of encoding (top) and maintenance (bottom) responses are shown (pseudo-t). Coronal and axial slices of the same images for each phase are shown on the left and right, respectively. Warmer colors denote ERS responses, while cooler colors denote ERD responses.
