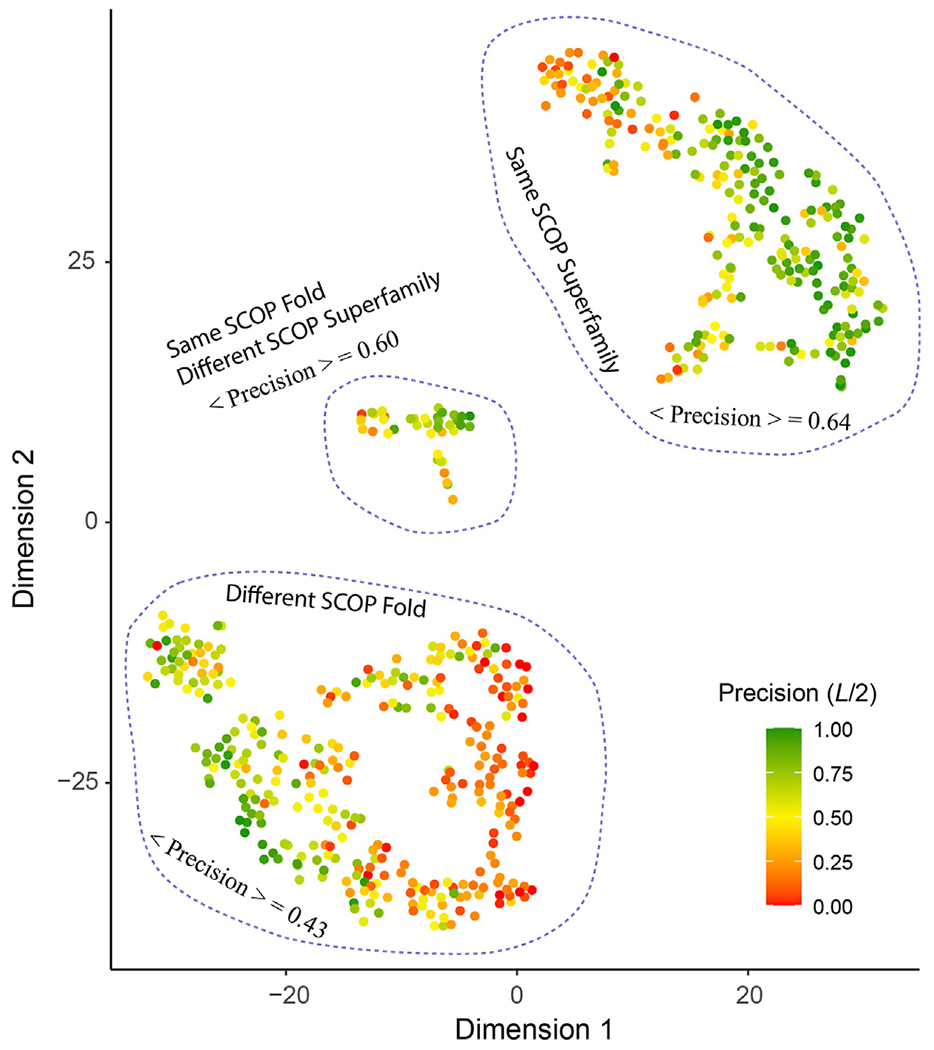
FIGURE 6 |.

T-SNE analysis of factors affect the precision of inter-residue distance predictions. Each point in the plot represents one of 593 target sequence, color-coded according to its precision value of the top L/2 Cα-Cα contact prediction for those belonging in the medium or long-range regime. The template pairs structurally most close to the target sequence found in the training set are classified according to their SCOP fold and Superfamily assignments. The brackets < · > denote the mean among all targets within the same cluster circled by dashed lines.
