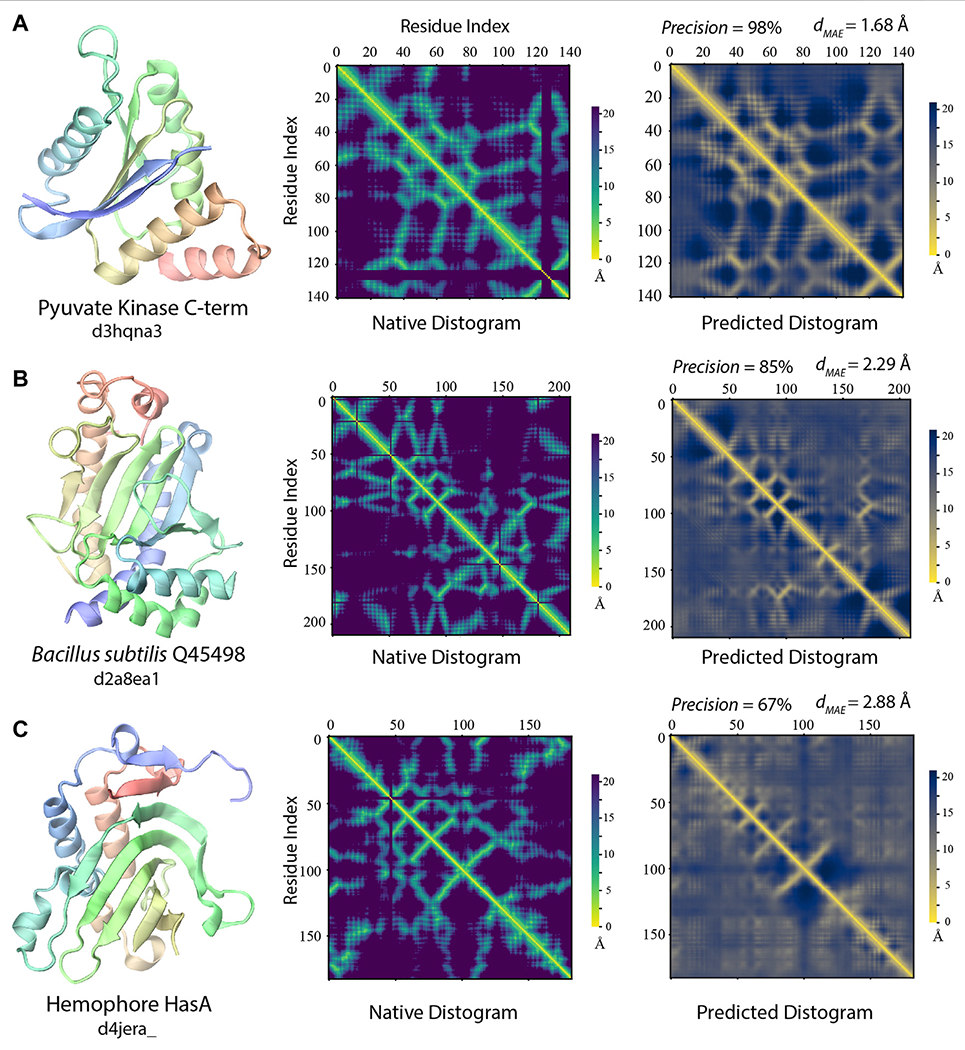
FIGURE 7 |.

Examples of distogram predictions by SAdLSA self-alignment in comparison to native protein structures. Each panel is one example taken from targets whose fellow SCOP fold members (if any) were not present in the training set. The same scheme as Figure 2 was adopted to display the native structure and its distogram. Black lines in the native distograms belong to gap or non-standard amino acids in a crystal structure. The predicted distogram was calculated using the mean residue-residue distance matrix D formulated in the Methods. The precision values are for the medium/long-range residue contacts within top L/2 predictions. The value of dMAE is obtained with Eq. 2.
