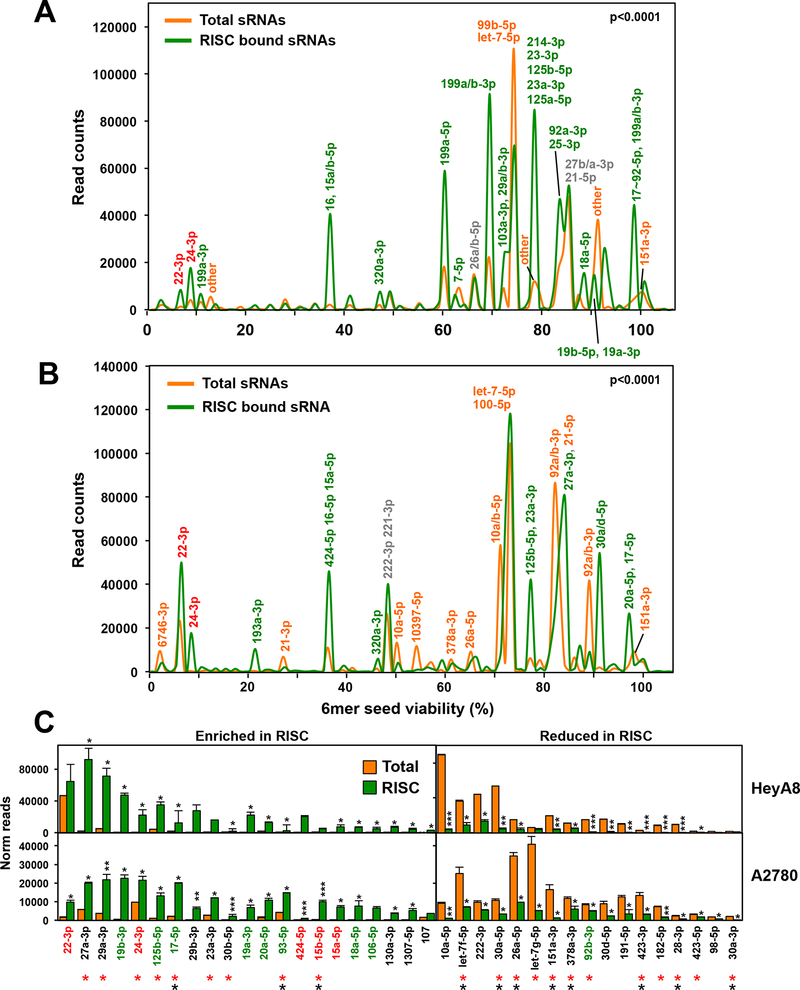
Figure 2.
Selective uptake of miRNAs into the RISC of OC cells. A and B, miRNA Seed Tox plots of either RISC-bound or total miRNAs in A2780 (A) and HeyA8 (B) cells. miRNAs that contribute to peaks with >5000 reads are labeled. For each labeled peak miRNAs are listed in the order of abundance. The percentage of miRNAs bound to the RISC was higher than the percentage of miRNAs in the total short (s)RNA population (79%/88.2% total and 97.6%/96.3% RISC bound in A2780 and HeyA8 cells, respectively). The seed viability (X axis) for HeyA8 cells was used (6merdb.org). The significance of the difference between total and RISC-bound small RNAs was established by performing a Kolmogorov-Smirnov (KS) test. Actual p-values were: A: D=0.13 (p < <1×10⁻¹⁵) B: D=0.11 (p < <1×10⁻¹⁵). C, All miRNAs with an average read number of >1000 in either cell line and >1.5 fold enriched (left) or reduced (right) in the RISC ranked according to the combined read numbers (total and RISC). Student’s t-test p-values are shown; **p<0.0001, ** p<0.001, * p<0.05. miRNAs with toxic seeds are shown in red and putative protective miRNAs with nontoxic seeds are shown in green. miRNAs that have been reported before to be enriched or depleted in the RISC in the same way in either 293T (red asterisks) or A549 (black asterisks) (43) are labeled.

