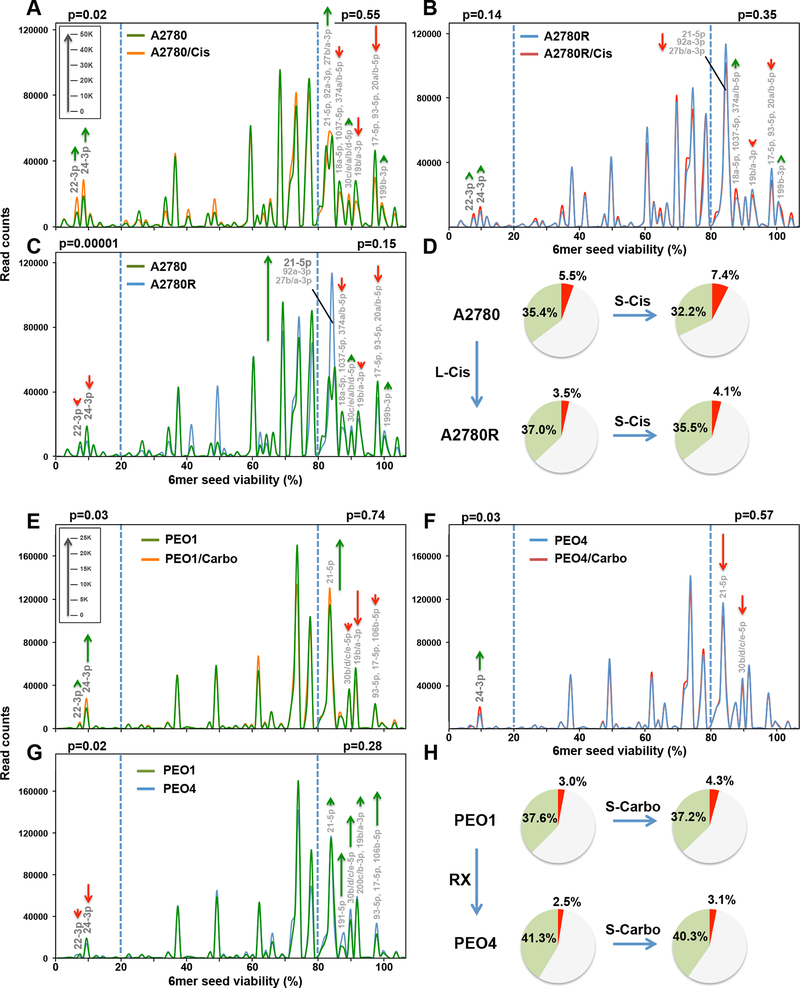
Figure 3.
Change in seed toxicity of RISC bound miRNAs in OC cells exposed to platinum. A and B, RISC-bound sRNA Seed Tox graphs of A2780 (A) or A2780R (B) cells treated with 5 μM Cis or PBS for 72 hrs. Green arrows, net increase, and red arrows, net decrease of >1000 reads in peak in Cis treated cells, respectively. C, RISC-bound sRNA Seed Tox graphs of PBS treated A2780 and A2780R cells. Green arrows, net increase, and red arrows, decrease of >1000 reads in peak in A2780R cells, respectively. D, RISC composition of A2780 cells or cells made resistant with long-term treatment with cisplatin (A2780R). Shown are pie-charts of short-term (S-Cis) or long-term (L-Cis) treated cells. Reads with a predicted 6mer seed viability of <20% are shown in red, >80% in green, and in between in grey. E, RISC-bound sRNA Seed Tox graphs of PEO1 cells treated with 1 μg/ml carboplatin (Carbo) or water for 72 hrs. Green arrows, net increase, and red arrows, net decrease of >1000 reads in peak in carboplatin treated cells, respectively. F, RISC-bound sRNA Seed Tox graphs of PEO4 cells treated with 1 μg/ml carboplatin or water for 72 hrs. G, RISC-bound sRNA Seed Tox graphs of water treated PEO1 and PEO4 cells. Green arrows, net increase, and red arrows, decrease of >1000 reads in peak in PEO4 cells, respectively. H, RISC composition of PEO1 or PEO4 cells. Shown are pie-charts of short-term (S-Carbo) or long-term (RX) treated cells isolated from patients. Reads with a predicted 6mer seed viability of <20% are shown in red, >80% in green, and in between in grey. P values were calculated using pairwise comparisons of all reads in the two different treatments in two groups: reads with predicted viability >80% and <20% (blue stippled lines). In these areas, the most significantly changed miRNAs are labeled. The average miRNA content of RISC bound sRNAs across all A2780/PEO samples was 97.6%/97.8%, respectively. Length of green and red arrows corresponds to number of reads (inserts in A and E).

