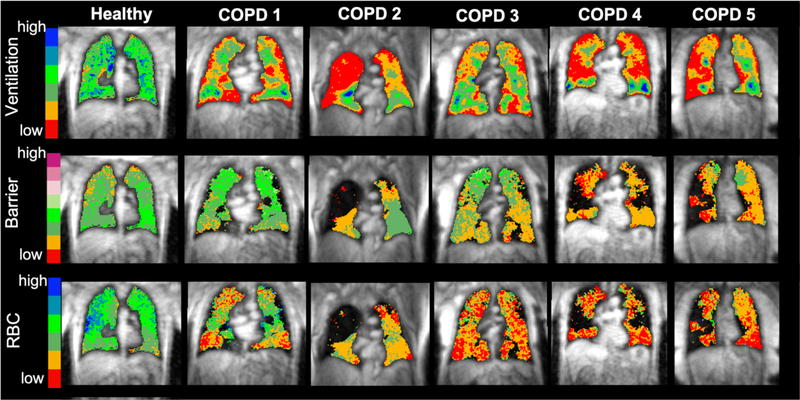
Figure 1. Example 129Xe MRI Maps of Ventilation, Barrier Uptake, and RBC Transfer.
Gas exchange maps of ventilation, barrier uptake, and RBC transfer from baseline scans from five example COPD subjects and a healthy subject for reference. All maps are overlaid on to an anatomical proton MRI scan for reference. On the ventilation map, the lowest two of the color bins correspond to the vendef+low measurement. Barrier and RBC images are also binned to aid in visual interpretation. Note that black areas are associated with regions of ventilation defect where analysis of barrier and RBC is not possible. The healthy subject underwent informed consent and imaging as part of another study in our lab and is presented here for solely for visual context.

