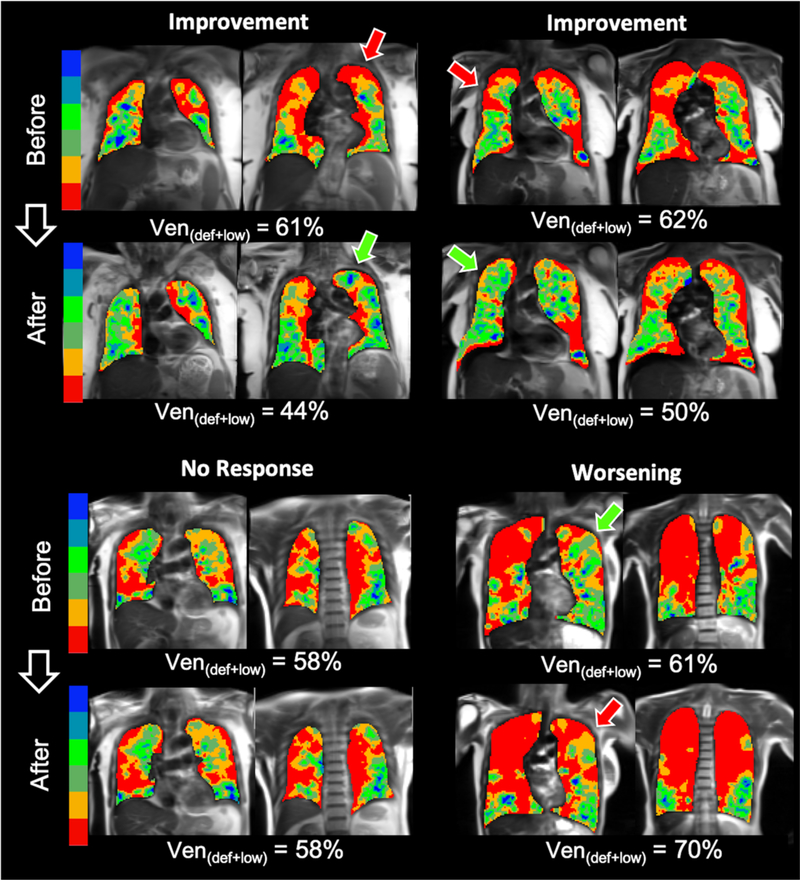
Figure 2. 129Xe MRI Ventilation Maps Before and After Therapy.
Representative images from four different subjects before and after therapy. The subjects in the top row showed improved (i.e. reduced) Vendef+low following therapy, while subjects in the bottom row exhibited no change (left) or worsening (right). Arrows indicate prominent regions where ventilation changed following therapy.

