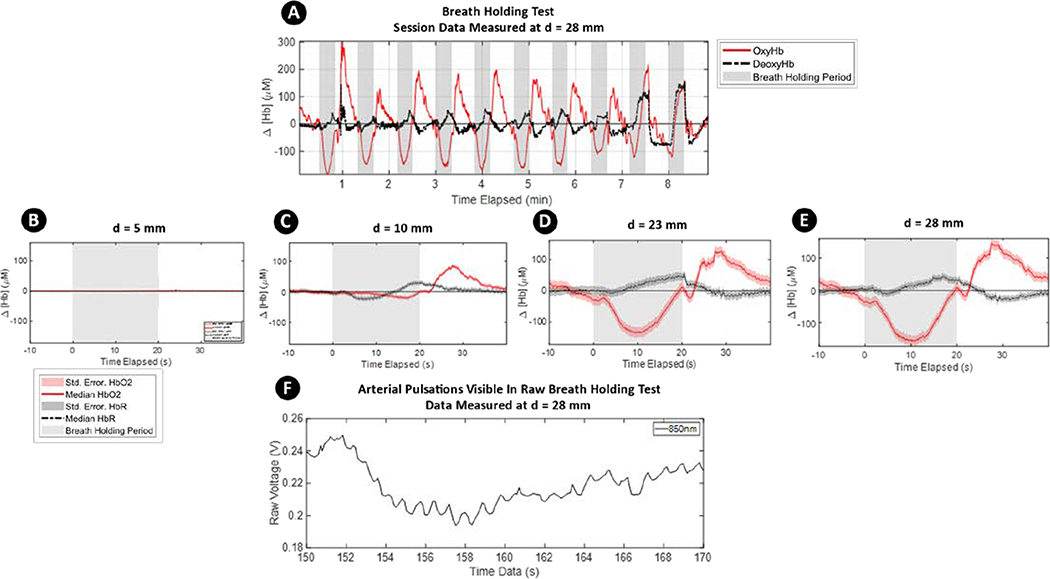
Figure 7:
Physiological validation using a breath-holding test. A) Complete session data. The solid red lines represent OxyHb, dashed black lines are DeoxyHb, and shaded gray areas represents breath-holding periods. Characteristic dips and recovery in OxyHb are visible in these data. B thru E) Block median with highlighted standard error of the median of 10 cycles measuring the change in baseline measurement with respect to the 10 seconds preceding the breath-holding period. An increase in source-detector separation results in deeper imaging into the head F) A segment of raw, unprocessed data from our fNIRS device during 850-nm LED light input is shown. Arterial pulsations are visible in the figure

