
Figure 1:
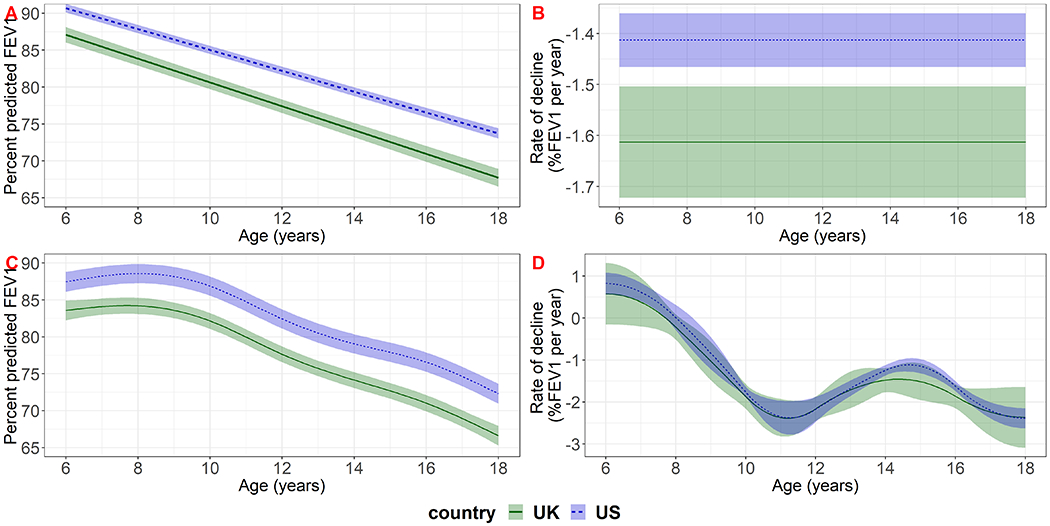
Estimated population-level mean lung function (panels A and C) and lung function decline (panels B and D) in the UK and US study populations for reference covariate values (female, born in 1997, diagnosed at birth). The top row (panels A and B) shows results based on the model that included a linear term for age with random intercept and slope and exponential correlation function; the bottom row (panels C and D) shows results based on the model that included age using a spline with 5 knots with random intercept and exponential correlation function.