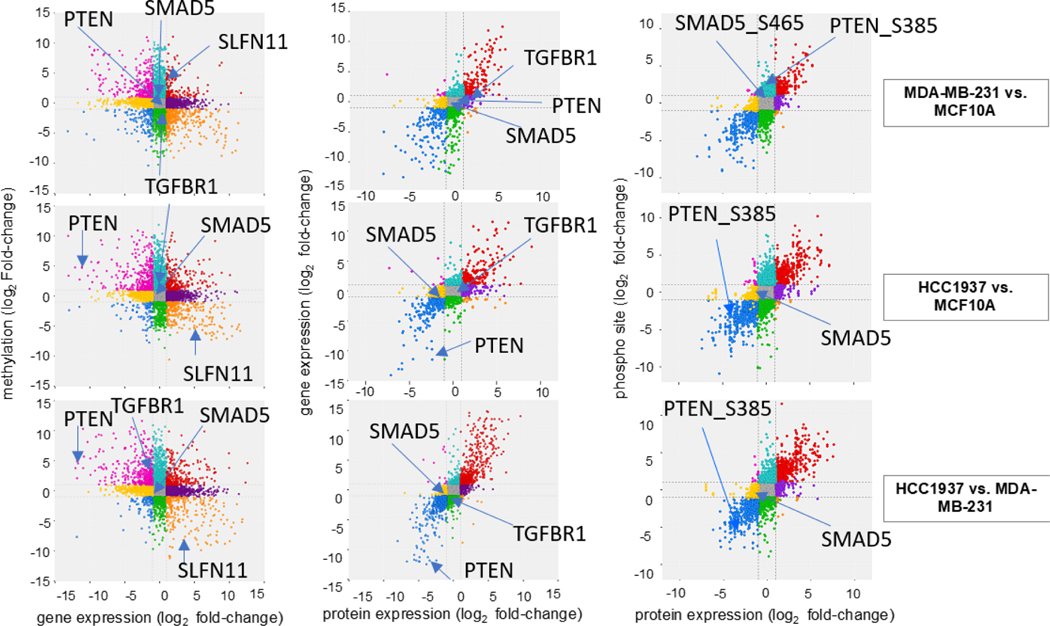
Figure 3. Correlation of multi-omics data sets.
The log2 fold change values for each multi-omics data set is displayed. Features with positive correlation (expression is significant and in the same direction) are shown in the top right and bottom left quadrants for RNAseq vs protein and the protein vs phosphorylated peptides. Hypermethylated gene promoters show a positive fold change value but indicate gene repression and are correlated with negative gene expression fold change values (top left quadrant). Hypomethylated gene promoter are correlated with positive gene expression fold change values (bottom right quadrant). Key features discussed in the results are highlighted.

