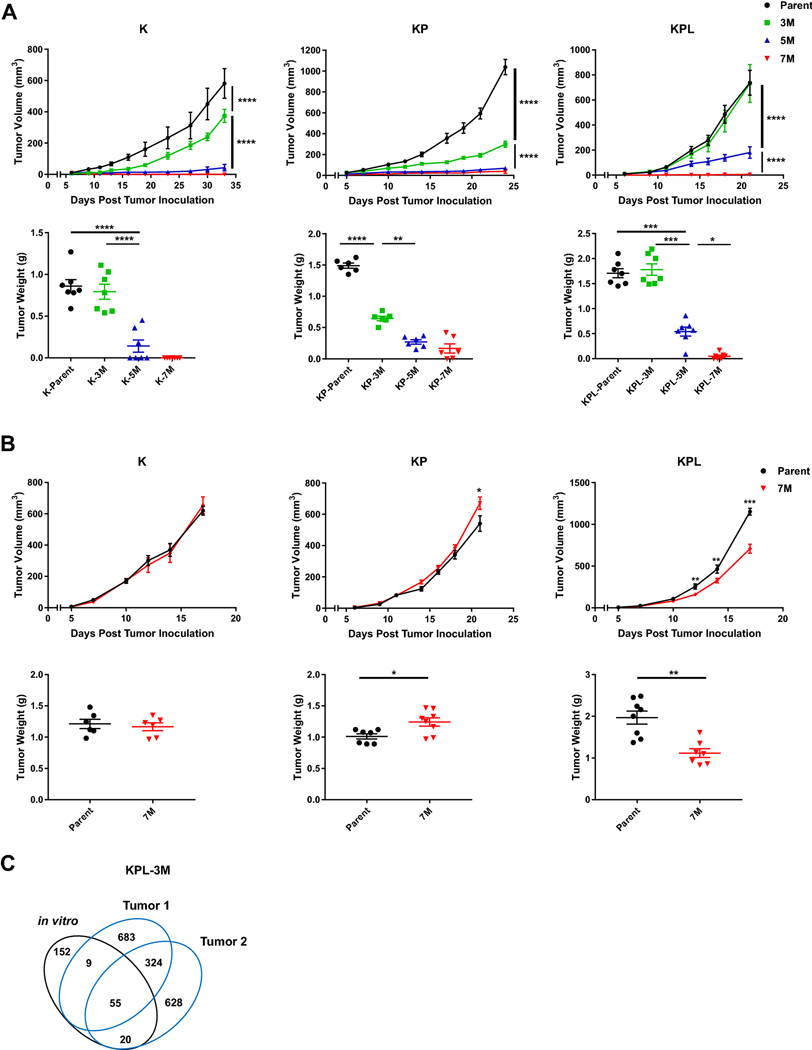
Fig. 2.
In vivo tumor growth in immunocompetent and SCID mice. a Within each family of cells, the Parent, 3M, 5M, and 7M cells were inoculated SC in immunocompetent mice [K (2 × 10⁶) cells in 129-E mice; KP (8 × 10⁵) cells in FVB mice; KPL (1 × 10⁵) cells in FVB mice] and tumor growth was measured with caliper. Growth curves and corresponding tumor weights after euthanasia are presented. b Same as in a except Parent and 7M cells were inoculated SC in SCID mice [K (2 × 10⁶) cells; KP (8 × 10⁵) cells; and KPL (1 × 10⁵) cells]. Data are representatives of at least two biological replicates of 6–10 mice per group. c Venn diagram of shared and private mutations of the KPL-3M cell line and two subcutaneous KPL-3M tumors from immunocompetent mice at day 25 post inoculation. P values were determined by two-tailed non-paired Student’s t test for pairwise comparison and two-way ANOVA with Tukey post-test for time-associated comparison among multiple groups. *P < 0.05; **P < 0.01; ***P < 0.001; ****P < 0.0001

