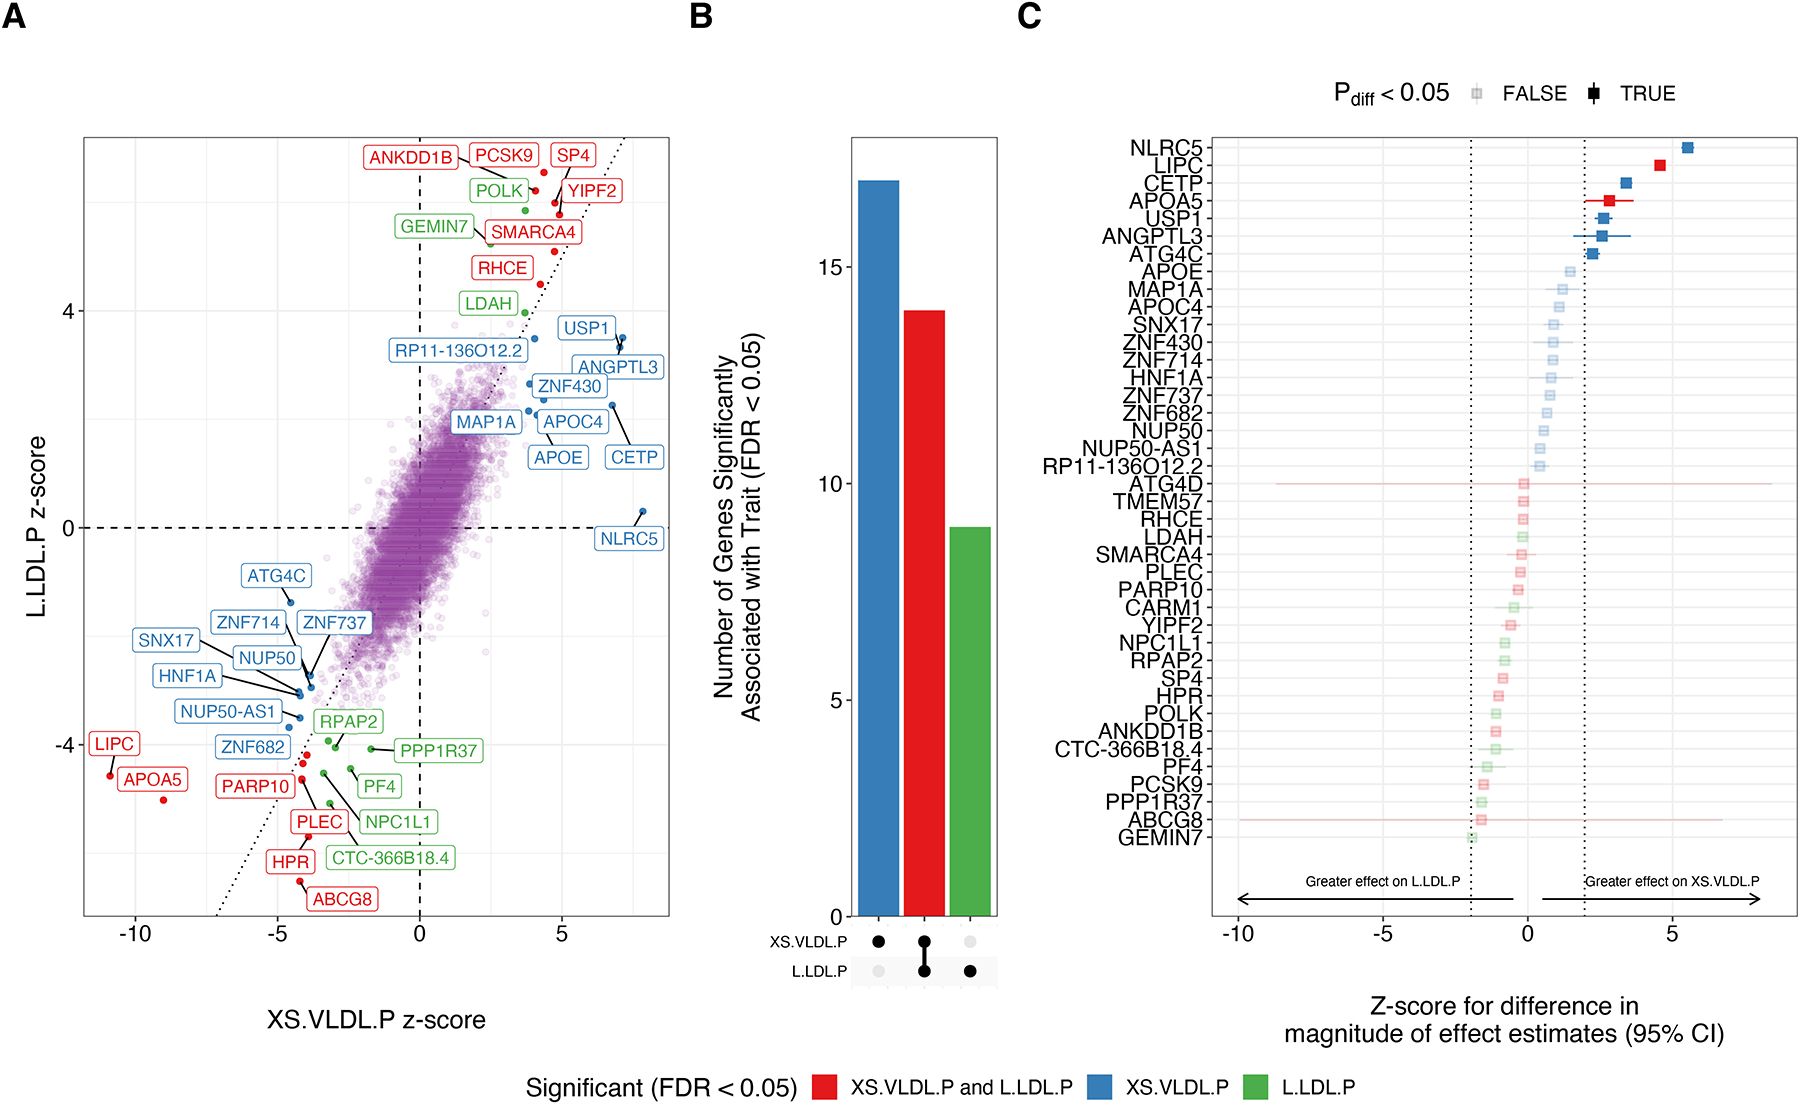
Figure 2: Genes Associated with Circulating Levels of XS.VLDL.P and L.LDL.P Lipoprotein Subfractions.

Transcriptome-wide association studies were performed integrating liver gene-expression data from GTEX v8 with GWAS summary statistics for XS.VLDL.P and L.LDL.P to identify genes associated with circulating levels of each lipoprotein subfraction. A) Genes significantly (FDR < 0.05) associated with either subfraction are labeled, and colors represent the subfraction associations. B) The bar plot depicts the number of unique and shared genes between the two subfractions. C) The forest plot depicts the z-score for the difference in the effect magnitude for each gene on each subfraction (). Dotted lines represent z-scores of +/− 1.96, with point estimates outside this range representing significant (pdiff < 0.05) differential effects. Errors represent 95% confidence intervals for the z-score.
